Adding horizontal and vertical grid lines
In this recipe, we will learn how to add and customize grid lines to graphs.
Getting ready
We will use the base graphics for this recipe, so all you need to do is run the recipe at the R prompt. It is good practice to save your code as a script for use again later.
How to do it...
Let's use the city rainfall example again to see how we can add grid lines to that graph:
rain<-read.csv("cityrain.csv")
plot(rain$Tokyo,type="b",lwd=2,
xaxt="n",ylim=c(0,300),col="black",
xlab="Month",ylab="Rainfall (mm)",
main="Monthly Rainfall in Tokyo")
axis(1,at=1:length(rain$Month),labels=rain$Month)

grid()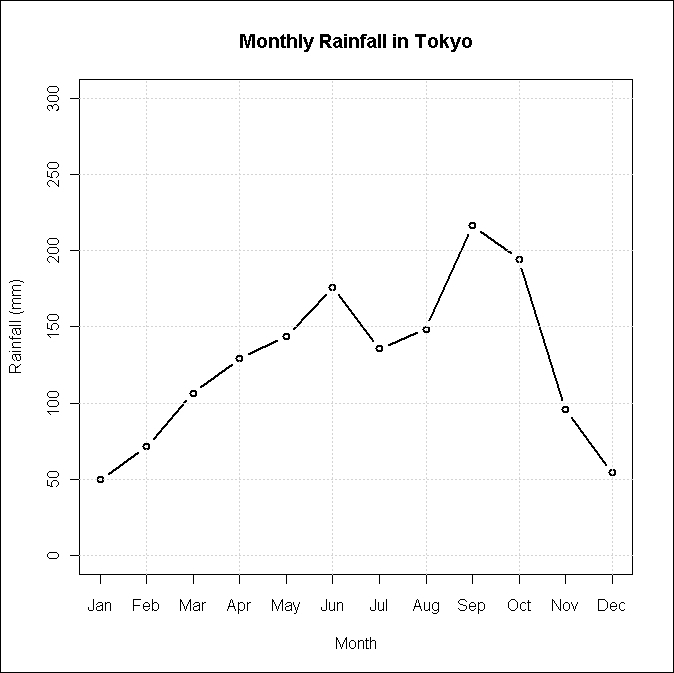
How it works...
It's ...
Get R: Data Analysis and Visualization now with the O’Reilly learning platform.
O’Reilly members experience books, live events, courses curated by job role, and more from O’Reilly and nearly 200 top publishers.

