Creating Quantile-Quantile plots
In this recipe, we will create Quantile-Quantile (Q-Q) plots, which are useful for comparing two probability distributions.
Getting ready
For this recipe, we don't need to load any additional libraries. We just need to type the recipe in the R prompt or run it as a script.
How to do it...
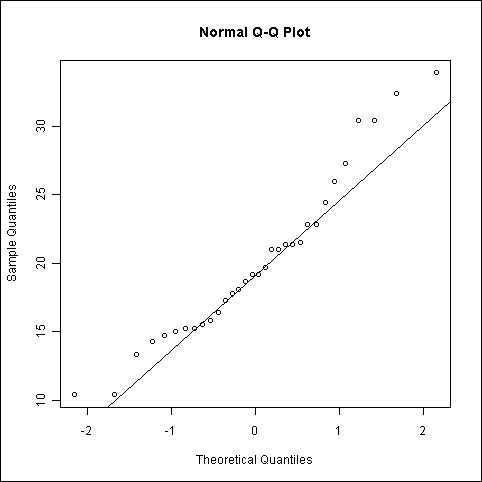
Let's see how the distribution of mpg in the mtcars dataset compares with a normal distribution using the qnorm() function:
qqnorm(mtcars$mpg)
qqline(mtcars$mpg)
How it works...
In this, we used the qqnorm() function to create a normal Q-Q plot of mpg values. We added a straight line with the
qqline() function. The closer the dots are ...
Get R: Data Analysis and Visualization now with the O’Reilly learning platform.
O’Reilly members experience books, live events, courses curated by job role, and more from O’Reilly and nearly 200 top publishers.

