Creating three-dimensional scatter plots
In this recipe, we will learn how to create three-dimensional scatter plots that can be very useful when we want to explore the relationships between more than two variables at a time.
Getting ready
We need to install and load the scatterplot3d package in order to run this recipe:
install.packages("scatterplot3d")
library(scatterplot3d)
How to do it...
Let's create the simplest default three-dimensional-scatter plot with our mtcars dataset:
scatterplot3d(x=mtcars$wt,
              y=mtcars$disp,
              z=mtcars$mpg)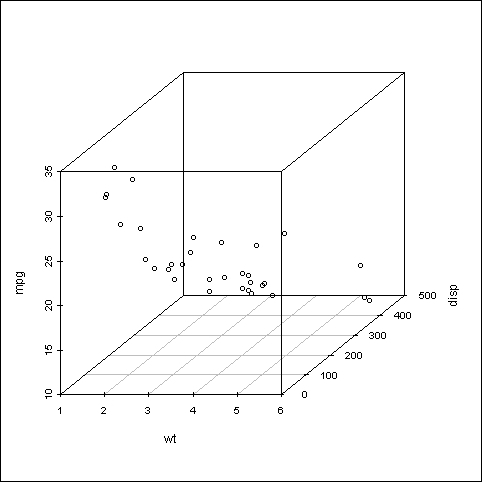
How it works...
That was easy! The scatterplot3d() functions much like the basic plot() function. In the preceding example, ...
Get R: Data Analysis and Visualization now with the O’Reilly learning platform.
O’Reilly members experience books, live events, courses curated by job role, and more from O’Reilly and nearly 200 top publishers.

