Adding nonparametric model curves with lowess
In this recipe, we will learn how to use lowess, which is a nonparametric model, and add the resulting prediction curve to a scatter plot.
Getting ready
For this recipe, we don't need to load any additional libraries. We just need to type the recipe in the R prompt or run it as a script.
How to do it...
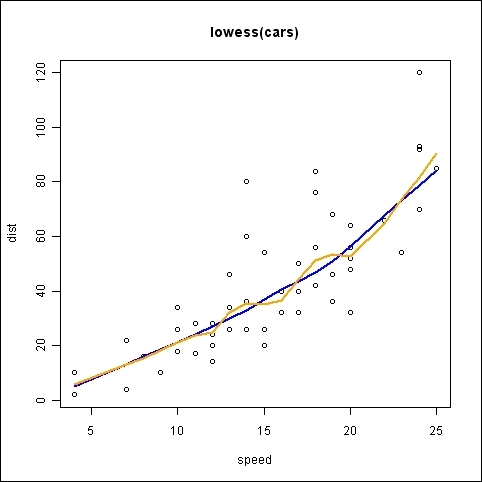
First, let's create a simple scatter plot with the preloaded cars dataset and add a couple of lowess lines to it:
plot(cars, main = "lowess(cars)")
lines(lowess(cars), col = "blue")
lines(lowess(cars, f=0.3), col = "orange")
How it works...
Standard R sessions include the lowess() function. It is a smoother ...
Get R: Data Analysis and Visualization now with the O’Reilly learning platform.
O’Reilly members experience books, live events, courses curated by job role, and more from O’Reilly and nearly 200 top publishers.

