Adding nonlinear model curves
In this recipe, we will learn how to fit and draw a nonlinear model curve to a dataset.
Getting ready
All you need for the next recipe is to type it at the R prompt as we will only use some base functions. You can also save the recipe code as a script so that you can use it again later on.
How to do it...
Plot an exponential plot:
x <- -(1:100)/10
y <- 100 + 10 * exp(x / 2) + rnorm(x)/10
nlmod <- nls(y ~  Const + A * exp(B * x), trace=TRUE)

plot(x,y)
lines(x, predict(nlmod), col="red")
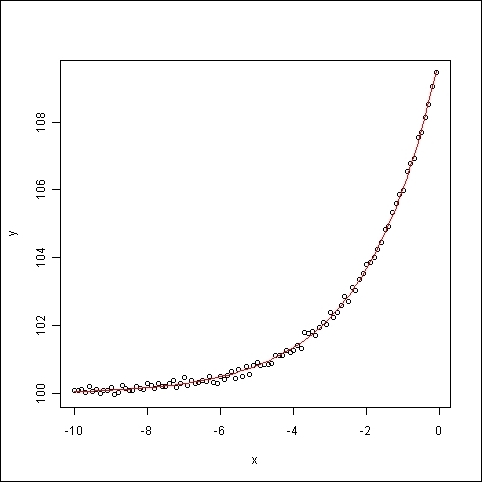
How it works...
We first plot y against x, where x is a variable defined using the: sequence operator and y is an exponential function of
Get R: Data Analysis and Visualization now with the O’Reilly learning platform.
O’Reilly members experience books, live events, courses curated by job role, and more from O’Reilly and nearly 200 top publishers.

