Adding linear model lines
In this recipe, we will learn how to fit a linear model and plot the linear regression line on a scatter plot.
Getting ready
All you need for the next recipe is to type it at the R prompt as we will only use some base functions. You can also save the recipe code as a script so that you can use it again later on.
How to do it...
Once again, let's use the mtcars dataset and draw a linear fit line for mpg versus disp:
plot(mtcars$mpg~mtcars$disp)
lmfit<-lm(mtcars$mpg~mtcars$disp)
abline(lmfit)
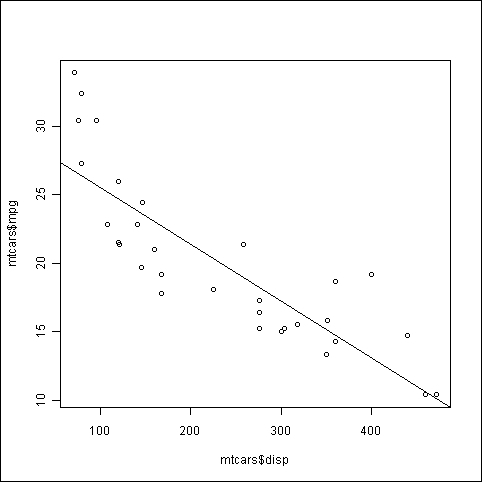
How it works...
We first draw the basic scatter plot of mpg versus disp. Then, we fit a linear model to the data using the lm() function, ...
Get R: Data Analysis and Visualization now with the O’Reilly learning platform.
O’Reilly members experience books, live events, courses curated by job role, and more from O’Reilly and nearly 200 top publishers.

