Labeling data points
In this recipe, we will learn how to label individual or multiple data points with text.
Getting ready
For this recipe, we don't need to load any additional libraries. We just need to type the recipe in the R prompt or run it as a script.
How to do it...
Let's say we want to highlight one data point in the cars' scatter plot that we used in the previous few recipes. We can label it using the text() command:
plot(mpg~disp, data=mtcars)
text(258,22,"Hornet")
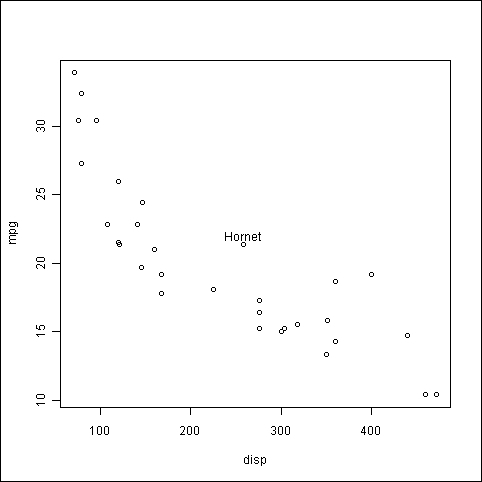
How it works...
In the preceding example, we first plotted the graph and then used the text() function to overlay a label at a specific location. The text() function takes the x ...
Get R: Data Analysis and Visualization now with the O’Reilly learning platform.
O’Reilly members experience books, live events, courses curated by job role, and more from O’Reilly and nearly 200 top publishers.

