Highlighting grouped data points by size and symbol type
Sometimes, we might not want to use different colors to represent different groups of data points. For example, some journals accept graphs only in grayscale. In this recipe, we will learn how we can highlight grouped data points by symbol size and type.
Getting ready
We will use the ggplot2 library, so let's load it by running the following command:
library(ggplot2)
How to do it...
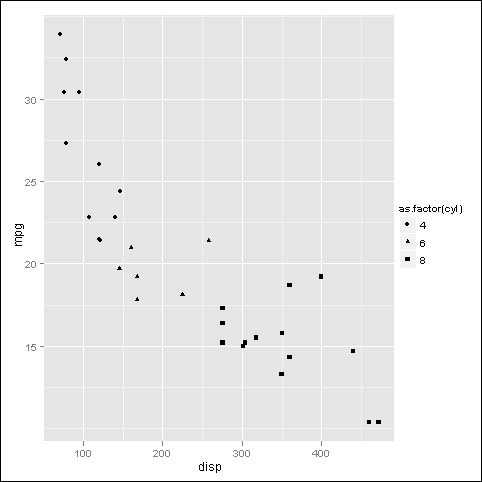
First, let's group points by the symbol type. Once again, we use the qplot() function:
qplot(disp,mpg,data=mtcars,shape=as.factor(cyl))
Next, let's group the points simply by the size of the plotting symbol:
qplot(disp,mpg,data=mtcars,size=as.factor(cyl)) ...
Get R: Data Analysis and Visualization now with the O’Reilly learning platform.
O’Reilly members experience books, live events, courses curated by job role, and more from O’Reilly and nearly 200 top publishers.

