Choosing box styles
The styles of various boxes drawn in a graph such as the one around the plotting region and the legend can be adjusted in a similar way to the line styles we saw in the last recipe.
Getting ready
All you need to try out in this recipe is to run R and type the recipe in the command prompt. You can also choose to save the recipe as a script so that you can use it again later on.
How to do it...
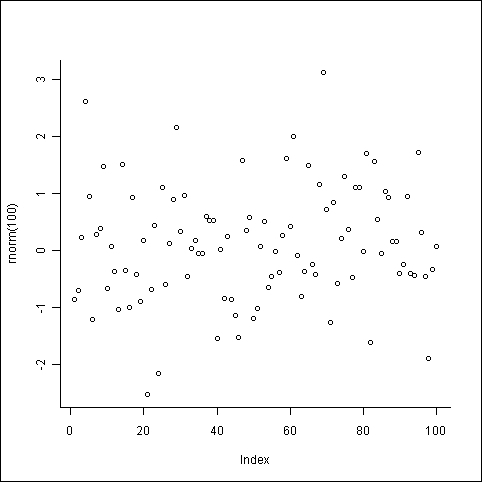
Let's say we want to create an L-shaped box around a graph such that the default top and right borders are not drawn. We can do so using the bty argument in the par() command:
par(bty="l")
plot(rnorm(100))
How it works...
The bty argument stands ...
Get R: Data Analysis and Visualization now with the O’Reilly learning platform.
O’Reilly members experience books, live events, courses curated by job role, and more from O’Reilly and nearly 200 top publishers.

