Setting colors of points, lines, and bars
In this recipe, you will learn the simplest way to change the colors of points, lines, and bars in scatter plots, line plots, histograms, and bar plots.
Getting ready
All you need to try out in this recipe is to run R and type the recipe in the command prompt. You can also choose to save the recipe as a script so that you can use it again later on.
How to do it...
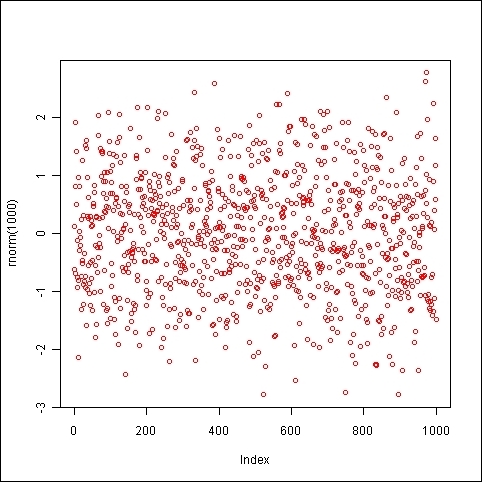
The simplest way to change the color of any graph element is using the
col argument. For example, the plot() function takes the col argument:
plot(rnorm(1000),
col="red")
If we choose the plot type as the line, then the color is applied to the plotted ...
Get R: Data Analysis and Visualization now with the O’Reilly learning platform.
O’Reilly members experience books, live events, courses curated by job role, and more from O’Reilly and nearly 200 top publishers.

