Creating heat maps
Heat maps are colorful images that are very useful to summarize a large amount of data by highlighting hotspots or key trends in the data.
How to do it...
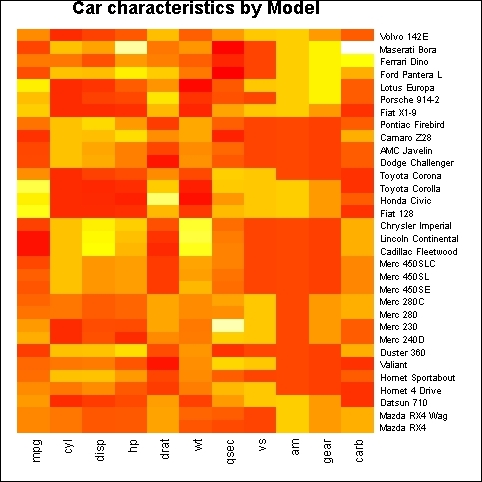
There are a few different ways to make heat maps in R. The simplest is to use the heatmap() function in the base library:
heatmap(as.matrix(mtcars),
Rowv=NA,
Colv=NA,
col = heat.colors(256),
scale="column",
margins=c(2,8),
main = "Car characteristics by Model")
How it works...
The example code has a lot of arguments, so it might look difficult at first sight. However, if we consider each argument in turn, we can understand how it works. The first argument to the heatmap() function ...
Get R: Data Analysis and Visualization now with the O’Reilly learning platform.
O’Reilly members experience books, live events, courses curated by job role, and more from O’Reilly and nearly 200 top publishers.

