Creating basic scatter plots
This recipe describes how to make scatter plots using some very simple commands. We'll go from a single line of code, which makes a scatter plot from preloaded data, to a script of few lines that produces a scatter plot customized with colors, titles, and axes limits specified by us.
Getting ready
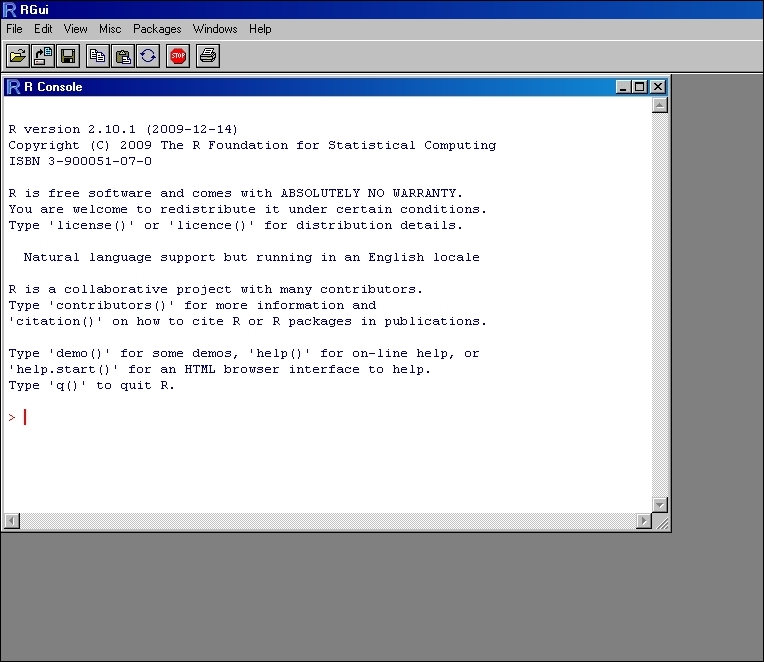
All you need to do to get started is start R. You should have the R prompt on your screen as shown in the following screenshot:
How to do it...
Let's use one of R's built-in datasets called cars to look at the relationship between the speed of cars and the distances taken to stop the cars (recorded in the 1920s).
To make your first ...
Get R: Data Analysis and Visualization now with the O’Reilly learning platform.
O’Reilly members experience books, live events, courses curated by job role, and more from O’Reilly and nearly 200 top publishers.

