Creating a dynamic Part-to-Whole pie chart
Many visualization experts will argue over the merits of the humble pie chart. Most, however, will agree that the following example, with many segments, is probably the least useful implementation.
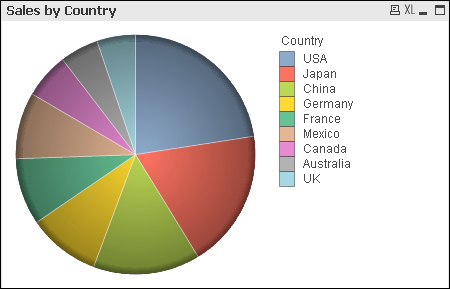
Pie charts are most useful when doing a simple part-to-whole comparison. In this recipe, we will create a dynamic part-to-whole bar chart that displays the sales value for the currently selected set of countries versus the rest.
Getting ready
Load the following script:
LOAD * INLINE [ Country, Sales USA, 53453 Mexico, 21317 Canada, 14545 UK, 12333 France, 21333 Germany, 23123 Japan, 44342 China, 34234 Australia, ...
Get QlikView for Developers Cookbook now with the O’Reilly learning platform.
O’Reilly members experience books, live events, courses curated by job role, and more from O’Reilly and nearly 200 top publishers.

