Creating a line chart with variable width lines
This is an interesting technique that has some rare enough applications. However, it could be a useful one to have in your arsenal.
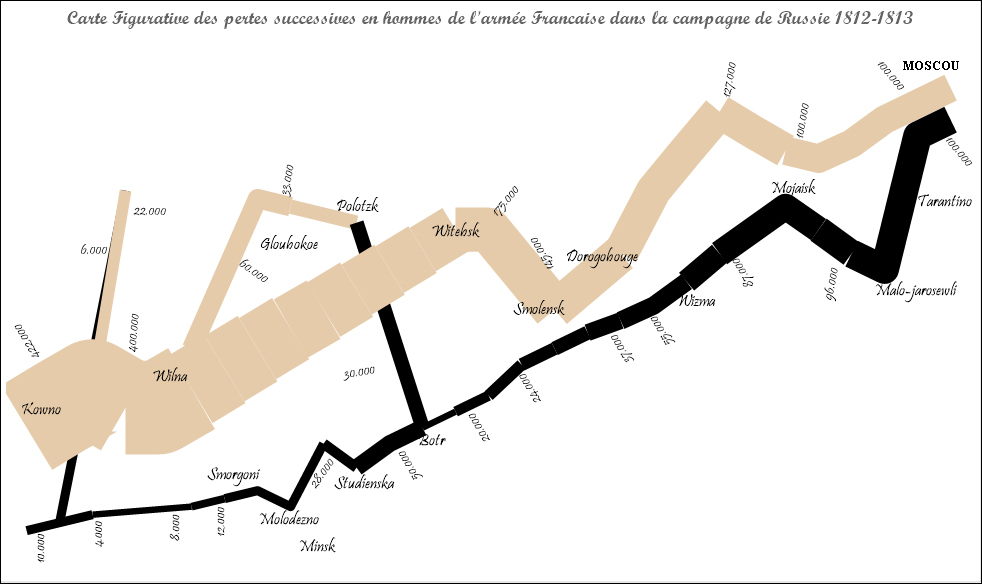
I used it to create my Homage to Minard (http://qliktips.blogspot.ie/2012/06/homage-to-minard.html).
Getting ready
Load the following script:
LOAD * INLINE [ Country, Sales, Target, Month USA, 1000, 1500, 2013-01-01 USA, 1200, 1600, 2013-02-01 USA, 3500, 1800, 2013-03-01 USA, 2500, 2000, 2013-04-01 USA, 3000, 2500, 2013-05-01 USA, 2500, 3000, 2013-06-01 UK, 1000, 1500, 2013-01-01 UK, 1700, 1600, 2013-02-01 UK, 2200, 1800, 2013-03-01 UK, 2000, 2000, 2013-04-01 UK, 1300, 2500, ...
Get QlikView for Developers Cookbook now with the O’Reilly learning platform.
O’Reilly members experience books, live events, courses curated by job role, and more from O’Reilly and nearly 200 top publishers.

