Visualizing the confusion matrix
A confusion matrix is a table that we use to understand the performance of a classification model. This helps us understand how we classify testing data into different classes. When we want to fine-tune our algorithms, we need to understand how the data gets misclassified before we make these changes. Some classes are worse than others, and the confusion matrix will help us understand this. Let's look at the following figure:
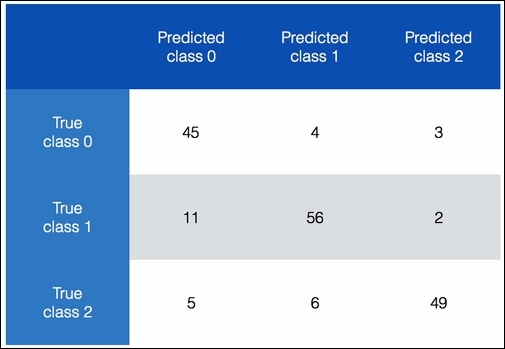
In the preceding chart, we can see how we categorize data into different classes. Ideally, we want all the nondiagonal elements to be 0. This would indicate perfect classification! Let's consider ...
Get Python Machine Learning Cookbook now with the O’Reilly learning platform.
O’Reilly members experience books, live events, courses curated by job role, and more from O’Reilly and nearly 200 top publishers.

