Creating our first chart
Now that we have all of the required Python modules installed, we can create our own charts using Matplotlib.
We can create charts from only a few lines of Python code.
Getting ready
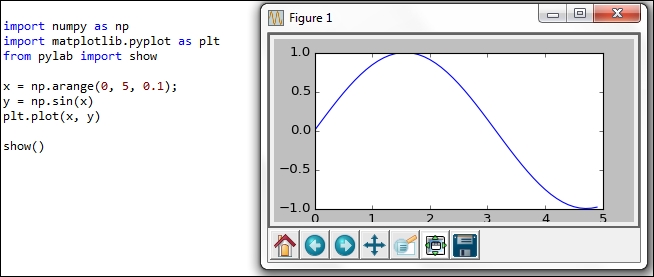
Using the code from the previous recipe, we can now create a chart that looks similar to the one shown next.
How to do it...
Using the minimum amount of code as presented on the official website, we can create our first chart. Well, almost. The sample code shown on the website does not work until we import the show method and then call it.
We can simplify the code and even improve it by using another of many examples provided on the official Matplotlib ...
Get Python GUI Programming Cookbook now with the O’Reilly learning platform.
O’Reilly members experience books, live events, courses curated by job role, and more from O’Reilly and nearly 200 top publishers.

