Drawing barbs
A barb is a representation of the speed and direction of wind, and is mainly deployed by meteorology scientists. In theory, they can be used to visualize any type of two-dimensional vector quantities. They are similar to arrows (quivers), but the difference is that arrows represent vector magnitude by the length of the arrow, while barbs give more information about the vector's magnitude by employing lines or triangles as increments of magnitude.
We will explain what barbs are, how to read them, and how to visualize them using Python and matplotlib. Here's a typical set of barbs:
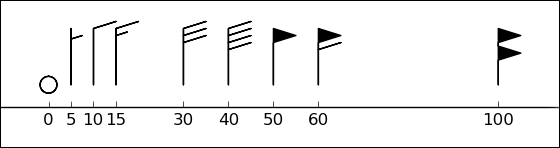
In the preceding diagram, the triangle, also known as ...
Get Python Data Visualization Cookbook - Second Edition now with the O’Reilly learning platform.
O’Reilly members experience books, live events, courses curated by job role, and more from O’Reilly and nearly 200 top publishers.

