Creating stem plot
A two-dimensional stem plot displays data as lines extending from a baseline along the x-axis. A circle (the default) or the other marker's y-position represents the data value that terminates each stem.
In this recipe, we will be discussing about how to create a stem plot.
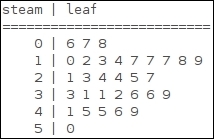
Do not confuse stem with stem and leaf plots, which is a method of representing data by separating the last important digit of values as leaves and higher order values as stems.
Getting ready
For this kind of plot, we need to use a sequence of discrete data, where ordinary an line plots wouldn't make sense anyway.
Plot discrete sequences as stems, where data values ...
Get Python Data Visualization Cookbook - Second Edition now with the O’Reilly learning platform.
O’Reilly members experience books, live events, courses curated by job role, and more from O’Reilly and nearly 200 top publishers.

