Legends and annotations
Legends are an important element that is used to identify the plot elements in a figure. The easiest way to show a legend inside a figure is to use the label argument of the plot function, and show the labels by calling the plt.legend() method:
>>> x = np.linspace(0, 1, 20)
>>> y1 = np.sin(x)
>>> y2 = np.cos(x)
>>> y3 = np.tan(x)
>>> plt.plot(x, y1, 'c', label='y=sin(x)')
>>> plt.plot(x, y2, 'y', label='y=cos(x)')
>>> plt.plot(x, y3, 'r', label='y=tan(x)')
>>> plt.lengend(loc='upper left')
>>> plt.show()
The output for the preceding command as follows:
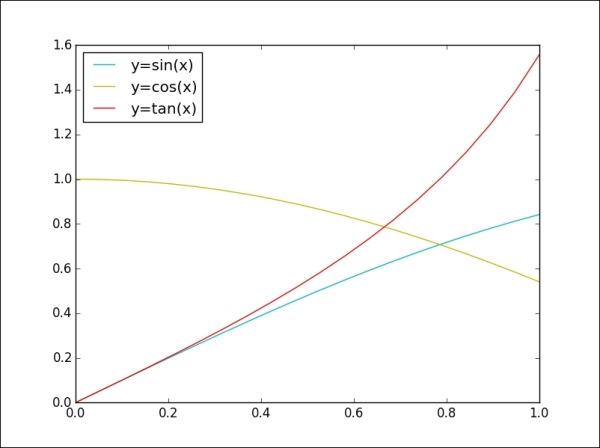
The loc argument in the legend command is used to figure out the position ...
Get Python: Data Analytics and Visualization now with the O’Reilly learning platform.
O’Reilly members experience books, live events, courses curated by job role, and more from O’Reilly and nearly 200 top publishers.

