Spectral analysis with periodograms
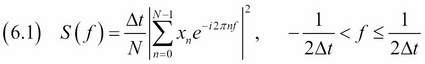
We can think of periodic signals as being composed of multiple frequencies. For instance, sound is composed of multiple tones and light is composed of multiple colors. The range of frequencies is called the frequency spectrum. When we analyze the frequency spectrum of a signal, it's natural to take a look at the result of the Fourier Transform of the signal. The periodogram extends this and is equal to the squared magnitude of the Fourier Transform, as follows:
We will look at the periodograms of the following variables:
- Rain values from the KNMI De Bilt weather data
- The second difference (comparable to second derivative ...
Get Python Data Analysis Cookbook now with the O’Reilly learning platform.
O’Reilly members experience books, live events, courses curated by job role, and more from O’Reilly and nearly 200 top publishers.

