The last few chapters focused on Pig Latin the language. Now
we will turn to the practical matters
of developing and testing your scripts. This chapter covers helpful
debugging tools such as describe and
explain. It also covers ways to test your scripts.
Information on how to make your scripts perform better will be covered in
the next chapter.
Pig provides several tools and diagnostic operators to help you develop your applications. In this section we will explore these and also look at some tools others have written to make it easier to develop Pig with standard editors and integrated development environments (IDEs).
Syntax highlighting often helps users write code correctly, at least syntactically, the first time around. Syntax highlighting packages exist for several popular editors. The packages listed in Table 7-1 were created and added at various times, so how their highlighting conforms with current Pig Latin syntax varies.
In addition to these syntax highlighting
packages, Pig will also let you check the syntax of your script without
running it. If you add -c or -check to the command line, Pig will just
parse and run semantic checks on your script. The -dryrun command-line
option will also check your syntax, expand any macros and
imports, and perform parameter substitution.
describe shows you the schema of a
relation in your script. This can be very helpful as you are developing
your scripts. It is especially useful as you are learning Pig Latin and
understanding how various operators change the data.
describe can be applied to any relation in your script, and
you can have multiple describes in a script:
--describe.pig
divs    = load 'NYSE_dividends' as (exchange:chararray, symbol:chararray,
            date:chararray, dividends:float);
trimmed = foreach divs generate symbol, dividends;
grpd    = group trimmed by symbol;
avgdiv  = foreach grpd generate group, AVG(trimmed.dividends);

describe trimmed;
describe grpd;
describe avgdiv;

trimmed: {symbol: chararray,dividends: float}
grpd: {group: chararray,trimmed: {(symbol: chararray,dividends: float)}}
avgdiv: {group: chararray,double}
describe uses Pig’s standard schema
syntax. For information on this syntax, see Schemas.
So, in this example, the relation trimmed has two fields: symbol, which is a chararray, and dividends, which is a float. grpd also has two fields, group (the name Pig always assigns to the
group by key) and a bag trimmed,
which matches the name of the relation that Pig grouped to produce the
bag. Tuples in trimmed have two
fields: symbol and dividends. Finally, in avgdiv there are two fields, group and a double, which is the result of the
AVG function and is unnamed.
One of Pig’s goals is to allow you to think in terms of
data flow instead of MapReduce. But sometimes you need to peek into the
barn and see how Pig is compiling your script into MapReduce jobs. Pig
provides explain for this. explain is
particularly helpful when you are trying to optimize your scripts or
debug errors. It was written so that Pig developers could
examine how Pig handled various scripts, thus its output is not the most
user-friendly. But with some effort, explain can help you
write better Pig Latin.
There are two ways to use explain.
You can explain any alias in your Pig Latin script, which
will show the execution plan Pig would use if you stored that relation.
You can also take an existing Pig Latin script and apply
explain to the whole script in Grunt. This has a couple of advantages. One, you do not
have to edit your script to add the explain line. Two, it
will work with scripts that do not have a single store, showing how Pig
will execute the entire script:
--explain.pig
divs   = load 'NYSE_dividends' as (exchange, symbol, date, dividends);
grpd   = group divs by symbol;
avgdiv = foreach grpd generate group, AVG(divs.dividends);
store avgdiv into 'average_dividend';

bin/pig -x local -e 'explain -script explain.pig'
This will produce a printout of several graphs
in text format; we will examine this output momentarily. When using
explain on a script in Grunt, you can also have it print
out the plan in graphical format. To do this, add -dot -out
to the preceding command
line. This prints out a file in DOT language containing diagrams
explaining how your script will be executed. Tools that can read this
language and produce graphs can then be used to view the graphs. For
some tools, you might need to split the three graphs in the file into
separate files.filename
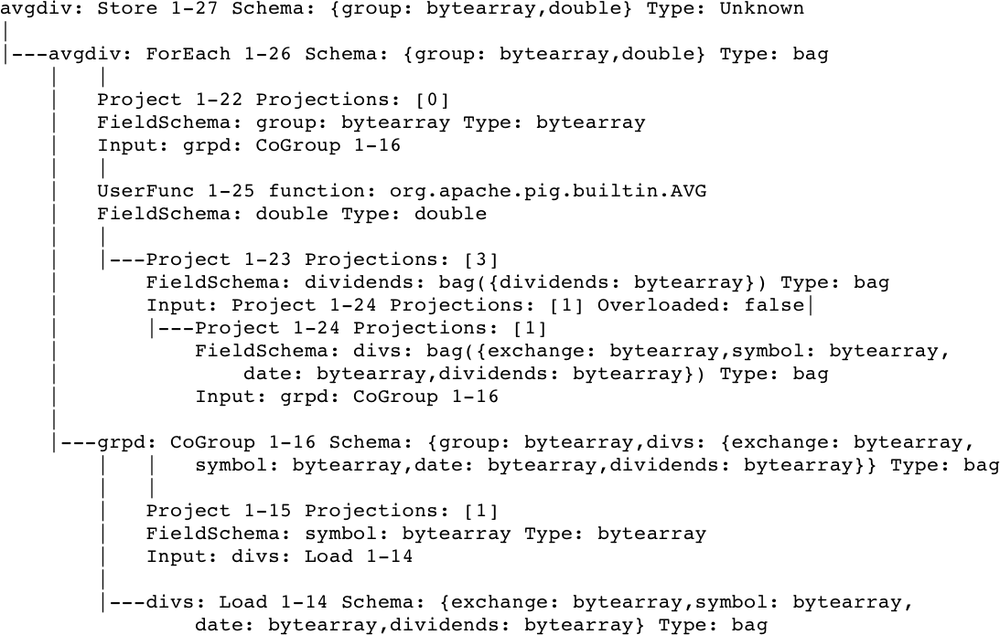
Pig goes through several steps to transform a Pig Latin script to a set of MapReduce jobs. After doing basic parsing and semantic checking, it produces a logical plan. This plan describes the logical operators that Pig will use to execute the script. Some optimizations are done on this plan. For example, filters are pushed as far up[19] as possible in the logical plan. The logical plan for the preceding example is shown in Figure 7-1. I have trimmed a few extraneous pieces to make the output more readable (scary that this is more readable, huh?). If you are using Pig 0.9, the output will look slightly different, but close enough that it will be recognizable.
The flow of this chart is bottom to top so that
the Load operator is at the very bottom. The lines
between operators show the flow. Each of the four operators created by
the script (Load, CoGroup, ForEach, and Store) can be seen. Each of these
operators also has a schema, described in standard schema syntax. The
CoGroup and ForEach operators also
have expressions attached to them (the lines dropping down from those
operators). In the CoGroup operator, the projection
indicates which field is the grouping key (in this case, field 1). The
ForEach operator has a projection expression that
projects field 0 (the group field) and a UDF expression, which indicates
that the UDF being used is org.apache.pig.builtin.AVG.
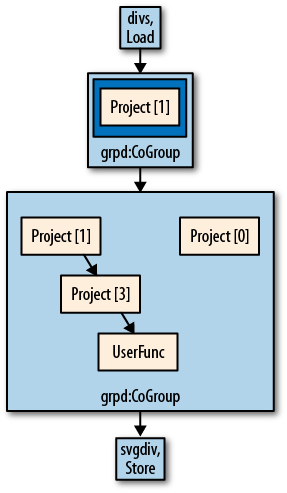
Notice how each of the Project operators has an
Input field, indicating from which operator they are
drawing their input. Figure 7-2 shows how
this plan looks when the -dot option is used
instead.
After optimizing the logical plan, Pig produces a physical plan. This plan describes the physical operators Pig will use to execute the script, without reference to how they will be executed in MapReduce. The physical plan for our plan in Figure 7-1 is shown in Figure 7-3.
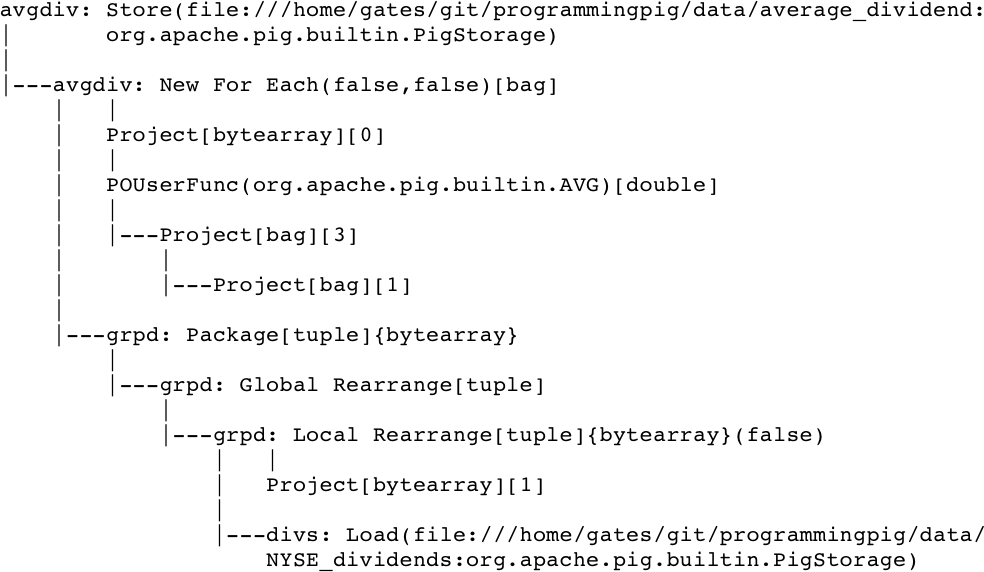
This looks like the logical plan, but with a few
differences. The load and store functions that will be used have been
resolved (in this case to
org.apache.pig.builtin.PigStorage, the default load and
store function), and the actual paths that will be used have been
resolved. This example was run in local mode, so the paths are local
files. If it had been run on a cluster, it would have showed a path like
hdfs://nn.machine.domain/filepath.
The other noticeable difference is that the
CoGroup operator was replaced by three
operators, Local Rearrange, Global Rearrange, and Package. Local
Rearrange is the operator Pig uses to prepare data for the
shuffle by setting up the key. Global Rearrange is a
stand-in for the shuffle. Package sits in the reduce
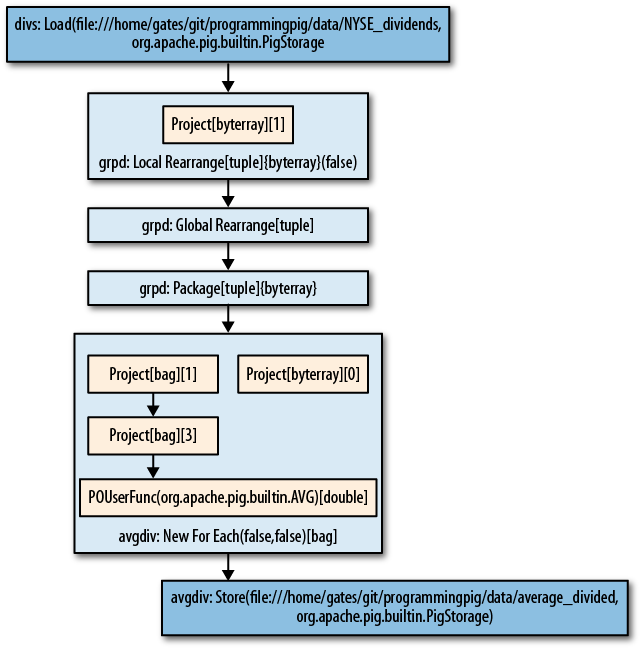
phase and directs records to the proper bag. Figure 7-4 shows a graphical representation of this
plan.
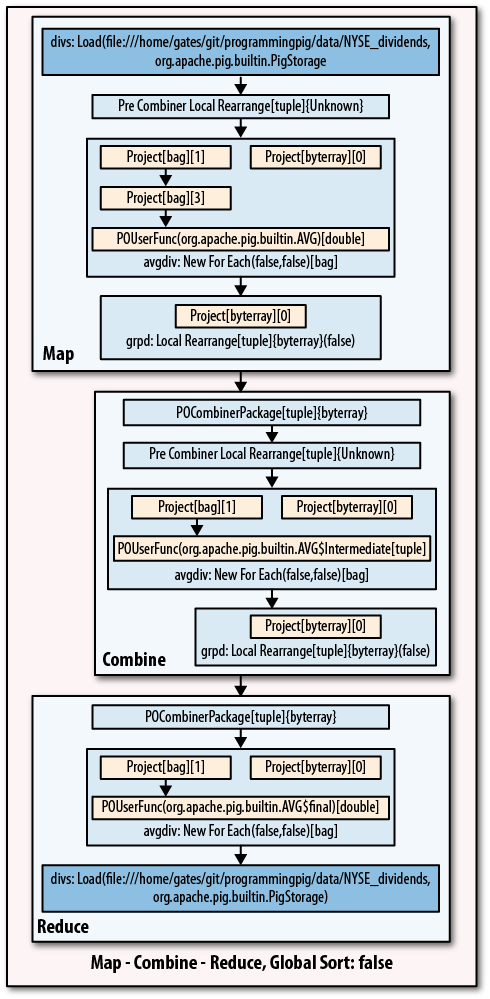
Finally, Pig takes the physical plan and decides
how it will place its operators into one or more MapReduce jobs. First,
it walks the physical plan looking for all operators that require a new
reduce. This occurs anywhere there is a Local
Rearrange, Global Rearrange, and
Package. After it has done this, it sees whether
there are places that it can do physical optimizations. For example, it
looks for places the combiner can be used, and whether sorts can be
avoided by including them as part of the sorting Hadoop does in the
shuffle. After all of this is done, Pig has a MapReduce plan. This plan
describes the maps, combines, and reduces, along with the physical
operations Pig will perform in each stage. Completing our example, the
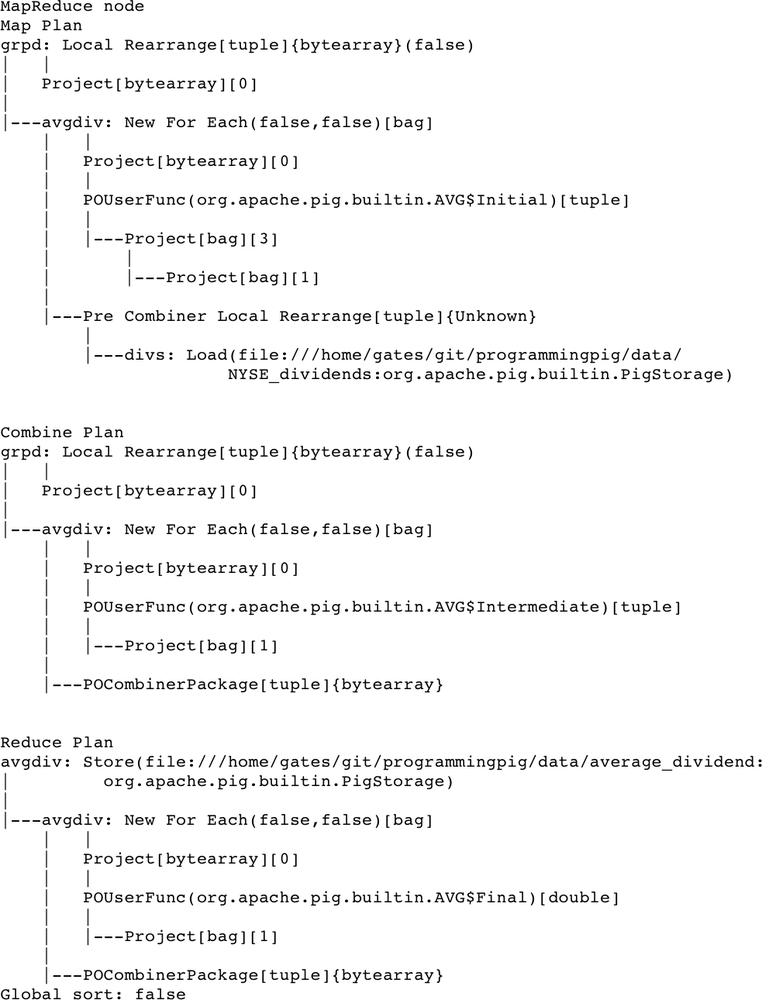
MapReduce plan is shown in Figure 7-5.
This looks much the same as the physical plan.
The pipeline is now broken into three stages: map, combine, and reduce.
The Global Rearrange operator is gone because it was
a stand-in for the shuffle. The AVG UDF has been broken up
into three stages: Initial in the map,
Intermediate in the combiner, and
Final in the reduce. If there were multiple MapReduce
jobs in this example, they would all be shown in this output. The
graphical version is shown in Figure 7-6.
Often one of the best ways to debug your Pig Latin script is to run your data through it. But if you are using Pig, the odds are that you have a large data set. If it takes several hours to process your data, this makes for a very long debugging cycle. One obvious solution is to run your script on a sample of your data. For simple scripts this works fine. But sampling has another problem: it is not always trivial to pick a sample that will exercise your script properly. For example, if you have a join, you have to be careful to sample records from each input such that at least some have the same key. Otherwise, your join will return no results.
To address this issue, the scientists in Yahoo!
Research built illustrate into Pig.
illustrate takes a sample of your data and runs it
through your script, but as it encounters operators that remove data
(such as filter, join, etc.), it
makes sure that some records pass through the operator and some do not.
When necessary, it will manufacture records that look like yours (i.e.,
that have the same schema) but are not in the sample it took. For
example, if your script had B = filter A by x > 100; and
every record that illustrate sampled had a value of less
than 100 for x,
illustrate would keep at least one of these records (to
show the filter removing a record), and it would manufacture a record
with x greater than 100.
To use illustrate, apply it to an
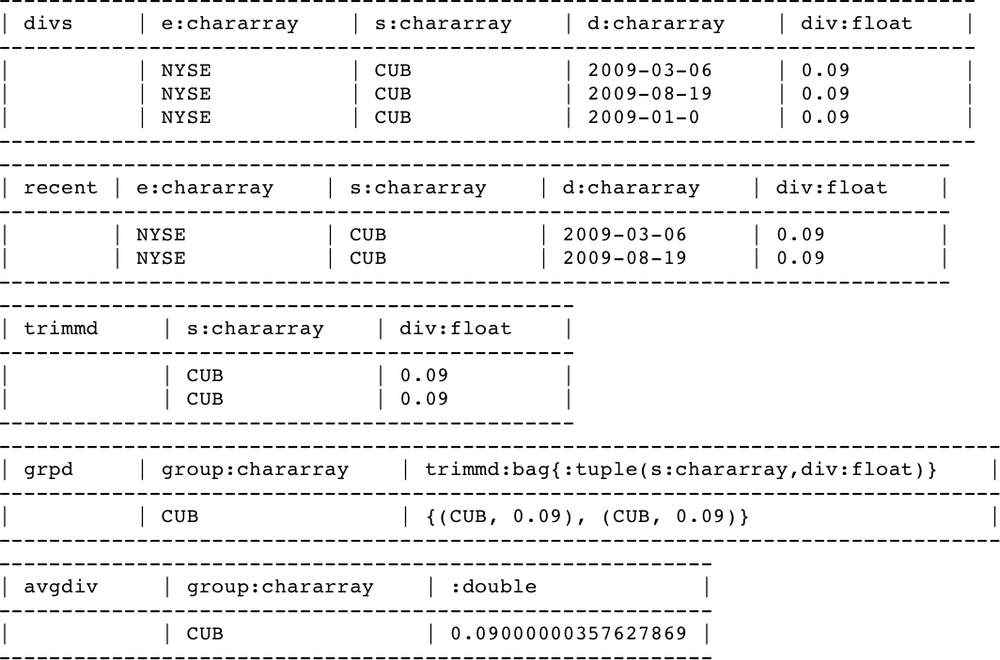
alias in your script, just as you would describe. Figure 7-7 shows the results of illustrating the
following script:
--illustrate.pig
divs   = load 'NYSE_dividends' as (e:chararray, s:chararray, d:chararray, div:float);
recent = filter divs by d > '2009-01-01';
trimmd = foreach recent generate s, div;
grpd   = group trimmd by s;
avgdiv = foreach grpd generate group, AVG(trimmd.div);
illustrate avgdiv;
For each relation here, illustrate
shows us records as they look coming out of the relation. For the line
recent = filter divs by d > '2009-01-01';, I
intentionally chose a filter that would remove no records in the input
to show how illustrate manufactures a record that will be
removed—in this case, the last record shown in the divs output.
Like explain,
illustrate can be given as a command-line option rather
than modifying your script; for example, bin/pig -e 'illustrate -script
illustrate.pig'.
illustrate was added to Pig in version
0.2, but it was not well maintained for a time. In version 0.9, it has
been revived. In versions 0.7 and 0.8, it works for some Pig operators
but not for others.
Beginning in version 0.8, Pig produces a summary set of statistics at the end of every run:
--stats.pig
a = load '/user/pig/tests/data/singlefile/studenttab20m' as (name, age, gpa);
b = load '/user/pig/tests/data/singlefile/votertab10k'
      as (name, age, registration, contributions);
c = filter a by age < '50';
d = filter b by age < '50';
e = cogroup c by (name, age), d by (name, age) parallel 20;
f = foreach e generate flatten(c), flatten(d);
g = group f by registration parallel 20;
h = foreach g generate group, SUM(f.d::contributions);
i = order h by $1, $0 parallel 20;
store i into 'student_voter_info';
Running stats.pig produces the statistics shown in Figure 7-8, reformatted slightly so it will fit on the page.
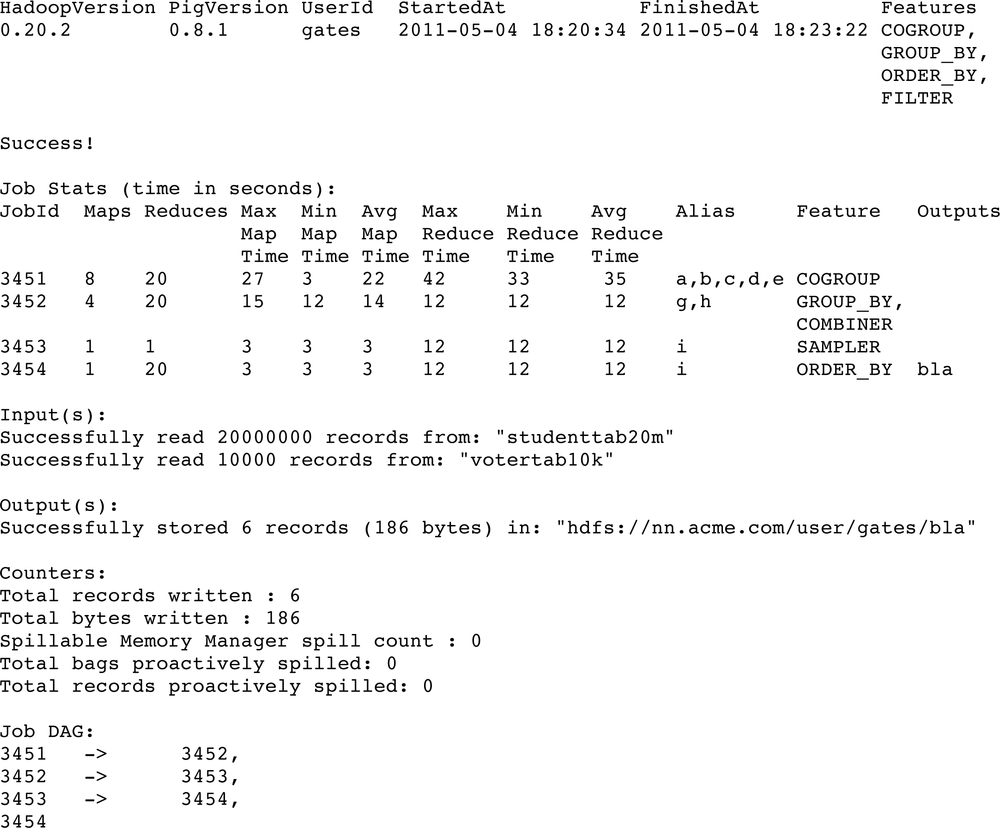
The first couple of lines give a brief summary
of the job. StartedAt is the time Pig
submits the job, not the time the first job starts running the Hadoop
cluster. Depending on how busy your cluster is, these may vary
significantly. Similarly, FinishedAt
is the time Pig finishes processing the job, which will be slightly
after the time the last MapReduce job finishes.
The section labeled Job
Stats gives a breakdown of each MapReduce job that was run.
This includes how many map and reduce tasks each job had, statistics on
how long these tasks took, and a mapping of aliases in your Pig Latin
script to the jobs. This last feature is especially useful when trying
to understand which operators in your script are running in which
MapReduce job, which can be helpful when determining why a particular
job is failing or producing unexpected results.
The Input,
Output, and Counters sections are self-explanatory. The
statistics on spills record how many times Pig spilled records to local
disk to avoid running out of memory. In local mode the Counters section will be missing because
Hadoop does not report counters in local mode.
The Job DAG
section at the end describes how data flowed between MapReduce jobs. In
this case, the flow was linear.
When you are running your Pig Latin scripts on your Hadoop
cluster, finding the status and logs of your job can be challenging.
Logs generated by Pig while it plans and manages your
query are stored in the current working directory. You can select a
different directory by passing -l
on the command line.
However, Hadoop does not provide a way to fetch back the logs from its
tasks. So, the logfile created by Pig contains only log entries
generated on your machine. Log entries generated during the execution,
including those generated by your UDFs, stay on the task nodes in your
Hadoop cluster. All data written to logdirstdout and stderr by map and reduce tasks is also kept in
the logs on the task nodes.
The first step to locating your logs is to
connect to the JobTracker’s web page. This page gives you the status of
all jobs currently running on your Hadoop cluster, plus the list of the
last hundred or so finished jobs. Generally, it is located at http://,
where jt.acme.com:50030/jobtracker.jspjt.acme.com is the address of your
JobTracker. Figure 7-9 shows a sample page taken
from a cluster running in pseudodistributed mode on a Linux
desktop.
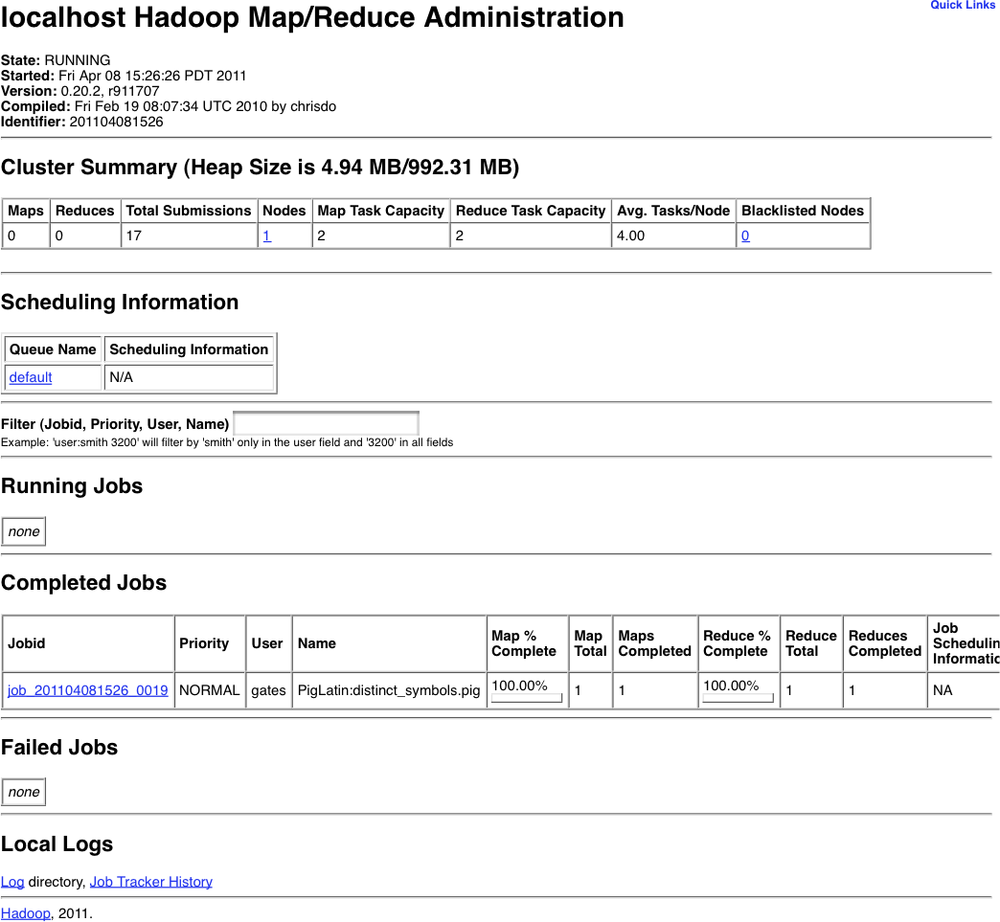
In this screenshot there, is only one job that has been run on the cluster recently. The user who ran the job, the job ID, and the job name are all listed. Jobs started by Pig are assigned the name of the Pig Latin script that you ran, unless you use the command-line option to change the job name. All jobs started by a single script will share the same name. In most cases you will have more than one MapReduce job resulting from your Pig job. As discussed earlier in Pig Statistics, Pig prints a summary at the end of its execution telling you which aliases and operators were placed in which jobs. When you have multiple jobs with the same name, this will help you determine which MapReduce job you are interested in. For the job in the screenshot shown in Figure 7-9, the relevant portions of the summary look like this:
Job Stats (time in seconds): JobId ... Alias Feature job_201104081526_0019 daily,grpd,uniqcnt GROUP_BY,COMBINER
Given this job ID, you now know which job to look at on the JobTracker page.
Note that jobs are shown on the JobTracker page only once they start to execute on your Hadoop cluster. It takes Pig a few seconds to parse your script and plan the MapReduce jobs it will run. It then takes a few seconds after Pig submits the first job before Hadoop begins running it. Also, the necessary resources might not be available, in which case your job will not appear until it has been assigned resources.
Clicking on the job ID will take you to a screen that summarizes the execution of the job, including when the job started and stopped, how many maps and reduces it ran, and the results of all of the counters, as shown in Figure 7-10.
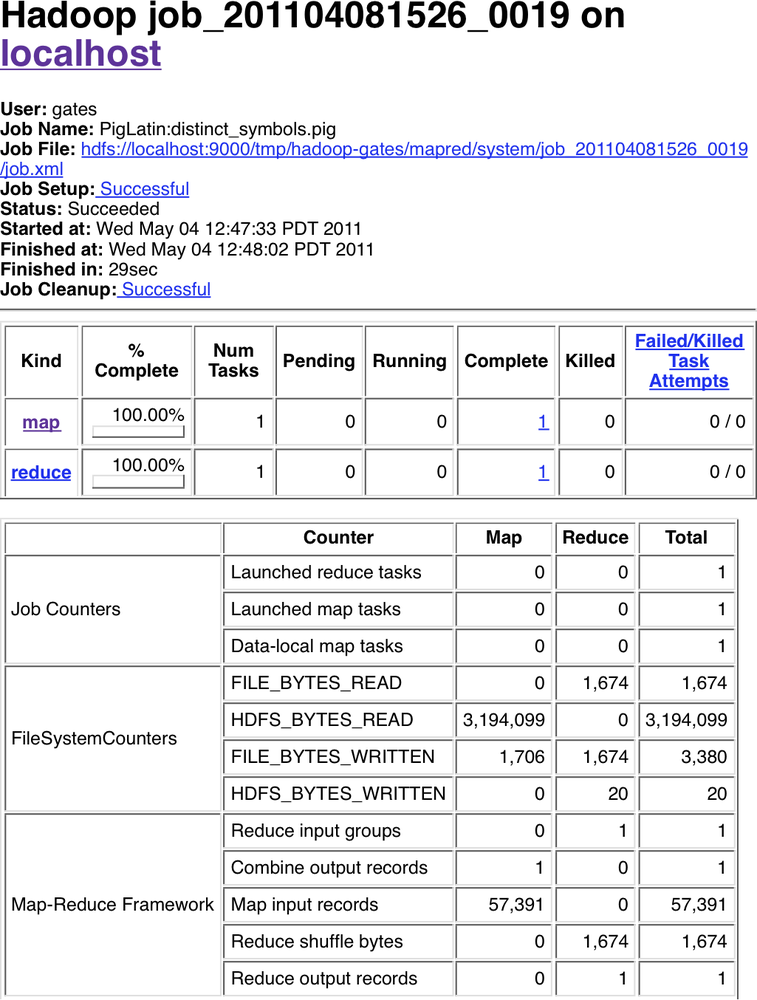
Let’s say you want to look at the logs for the single map task in this job. In the table toward the top of the page that summarizes the results of the map and reduce tasks, clicking on “map” in the far-left column produces a list of all map tasks that were run as part of this job. Selecting any particular task will show you the machine the task ran on, its status, its start and end times, and will then provide a link to its logfile. Clicking on that link will (finally) allow you to see the log for that individual task.
Of course, in this example, finding the map task we wanted was easy because there was only one. But what happens when your job has 10,000 map tasks? How do you know which one to look at? This is a good question that does not always have a concise answer. If your tasks are failing only periodically, you can examine the logs of the failing tasks. If they are all failing, you should be able to pick any of them, since they are all running the same code. If your job is running slower than it seems like it should, you can look for tasks that took much longer than others. It is also often useful to look to see if all maps or all reduces take about the same amount of time. If not, you have a skew problem.
Beyond the tools covered previously, there are a few
things I have found useful in debugging Pig Latin scripts. First, if
illustrate does not do what you need, use local mode to
test your script before running it on your Hadoop cluster. In most
cases, this requires you to work with a sample of your data, which could
be difficult, as explained earlier in illustrate. But
local mode has several advantages. One, despite its slowness, it is a
faster turnaround than using a Hadoop grid, where you may have to wait
to get slots, and the minimum job setup time is 30 seconds (versus about
10 seconds in local mode). Two, the logs for your operations appear on
your screen, instead of being left on a task node somewhere. Three,
local mode runs all in your local process. This means that you can
attach a debugger to the process. This is particularly useful when you
need to debug your UDFs.
A second tip I have found useful is that sometimes you need to turn off particular features to see whether they are the source of your problem. These can include particular optimizations that Pig attempts or new features that have not had all the bugs worked out yet.[20] Table 7-2 lists features that can be turned off. All of these are options that can be passed to Pig on the command line.
Table 7-2. Turning off features
Note
In Pig 0.8.0, the logical optimizer and logical plan were completely rewritten. The new optimizer and plan are used by default in 0.8.0, but old ones are available as a backup. After releasing 0.8.0, a number of issues were found with the new optimizer and plan. If you are using 0.8.0, I strongly encourage you to upgrade to Pig 0.8.1. As of the time of this writing, all known logical plan and optimizer issues in 0.8.0 were fixed in 0.8.1. If upgrading is not an option, the workaround is to turn off the new logical plan as described in Table 7-2. In Pig 0.9, the old logical plan has been removed.
As part of your development, you will want to test your Pig Latin scripts. Even once they are finished, regular testing helps assure that changes to your UDFs, to your scripts, or in the versions of Pig and Hadoop that you are using do not break your code. PigUnit provides a unit-testing framework that plugs into JUnit to help you write unit tests that can be run on a regular basis. PigUnit was added in Pig 0.8.
Let’s walk through an example of how to test a script with PigUnit. First, you need a script to test:
--pigunit.pig
divs   = load 'NYSE_dividends' as (exchange, symbol, date, dividends);
grpd   = group divs all;
avgdiv = foreach grpd generate AVG(divs.dividends);
store avgdiv into 'average_dividend';
Second, you will need the pigunit.jar JAR file.
This is not distributed as part of the standard Pig distribution, but you
can build it from the source code included in your distribution. To do
this, go to the directory your distribution is in and type ant
jar pigunit-jar. Once this is finished, there should be two
files in the directory: pig.jar and
pigunit.jar. You will need to place
these in your classpath when running PigUnit tests.
Third, you need data to run through your script. You can use an existing input file, or you can manufacture some input in your test and run that through your script. We will look at how to do both.
Finally, you need to write a Java class that JUnit can use to run your test. Let’s start with a simple example that runs the preceding script:
 // java/example/PigUnitExample.java
public class PigUnitExample {
    private PigTest test;
    private static Cluster cluster;

    @Test
    public void testDataInFile() throws ParseException, IOException {
        // Construct an instance of PigTest that will use the script
        // pigunit.pig.
        test = new PigTest("../pigunit.pig");

        // Specify our expected output.  The format is a string for each line.
        // In this particular case we expect only one line of output.
        String[] output = { "(0.27305267014925455)" };

        // Run the test and check that the output matches our expectation.
        // The "avgdiv" tells PigUnit what alias to check the output value
        // against.  It inserts a store for that alias and then checks the
        // contents of the stored file against output.
        test.assertOutput("avgdiv", output);
    }
}
You can also specify the input inline in your test rather than relying on an existing datafile:
// java/example/PigUnitExample.java
    @Test
    public void testTextInput() throws ParseException, IOException  {
        test = new PigTest("../pigunit.pig");

        // Rather than read from a file, generate synthetic input.
        // Format is one record per line, tab-separated.
        String[] input = {
            "NYSE\tCPO\t2009-12-30\t0.14",
            "NYSE\tCPO\t2009-01-06\t0.14",
            "NYSE\tCCS\t2009-10-28\t0.414",
            "NYSE\tCCS\t2009-01-28\t0.414",
            "NYSE\tCIF\t2009-12-09\t0.029",
        };

        String[] output = { "(0.22739999999999996)" };

        // Run the example script using the input we constructed
        // rather than loading whatever the load statement says.
        // "divs" is the alias to override with the input data.
        // As with the previous example, "avgdiv" is the alias
        // to test against the value(s) in output.
        test.assertOutput("divs", input, "avgdiv", output);
    }
It is also possible to specify the Pig Latin script in your test and to test the output against an existing file that contains the expected results:
 // java/example/PigUnitExample.java
    @Test
    public void testFileOutput() throws ParseException, IOException {
        // The script as an array of strings, one line per string.
          String[] script = {
            "divs   = load '../../../data/NYSE_dividends' as (exchange, symbol,
            "grpd   = group divs all;",
            "avgdiv = foreach grpd generate AVG(divs.dividends);",
            "store avgdiv into 'average_dividend';",
        };
        test = new PigTest(script);

        // Test output against an existing file that contains the
        // expected output.
        test.assertOutput(new File("../expected.out"));
    }
Finally, let’s look at how to integrate PigUnit with parameter substitution, and how to specify expected output that will be compared against the stored result (rather than specifying an alias to check):
 // java/example/PigUnitExample.java
    @Test
    public void testWithParams() throws ParseException, IOException {
        // Parameters to be substituted in Pig Latin script before the
        // test is run.  Format is one string for each parameter,
        // parameter=value
        String[] params = {
            "input=../../../data/NYSE_dividends",
            "output=average_dividend2"
        };
        test = new PigTest("../pigunitwithparams.pig", params);

        String[] output = { "(0.27305267014925455)" };

        // Test output in stored file against specified result
        test.assertOutput(output);
    }
These examples can be run by using the build.xml file included in the examples from this chapter. These examples are not exhaustive; see the code itself for a complete listing. For more in-depth examples, you can check out the tests for PigUnit located in test/org/apache/pig/test/pigunit/TestPigTest.java in your Pig distribution. This file exercises most of the features of PigUnit.
[19] Or down, whichever you prefer. Database textbooks usually talk
of pushing filters down, closer to the scan. Because Pig Latin
scripts start with a load at the top and go down, we
tend to refer to it as pushing filters up toward the
load.
[20] If you find you are turning off a feature to avoid a bug, please file a JIRA ticket so that the problem can be fixed.
Get Programming Pig now with the O’Reilly learning platform.
O’Reilly members experience books, live events, courses curated by job role, and more from O’Reilly and nearly 200 top publishers.

