Appendix D. Maps
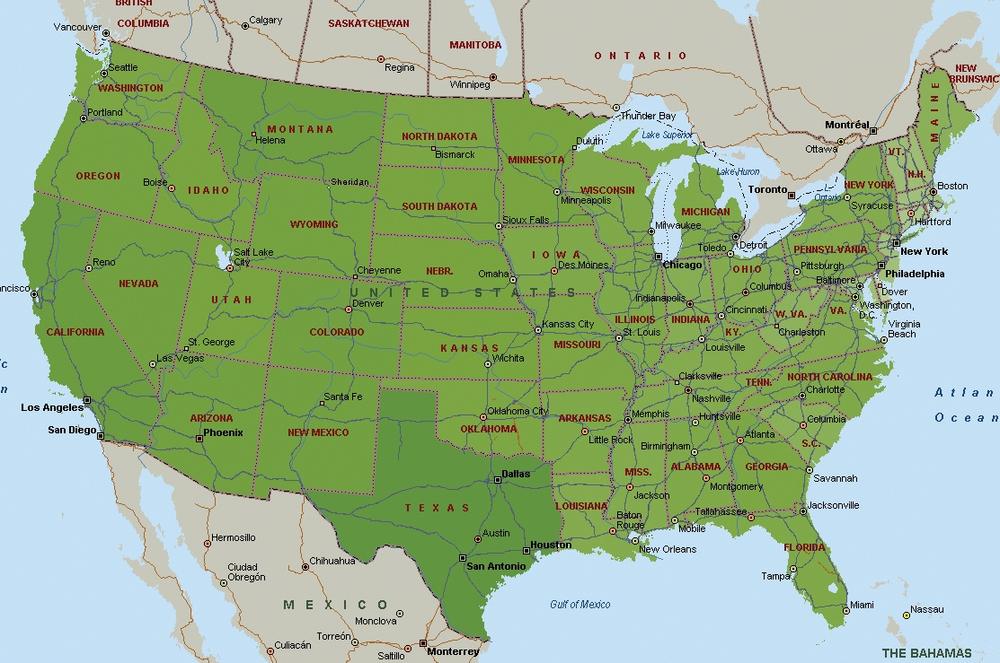
Figure Color Plate-1. (Figure 3-2).Shaded
area map
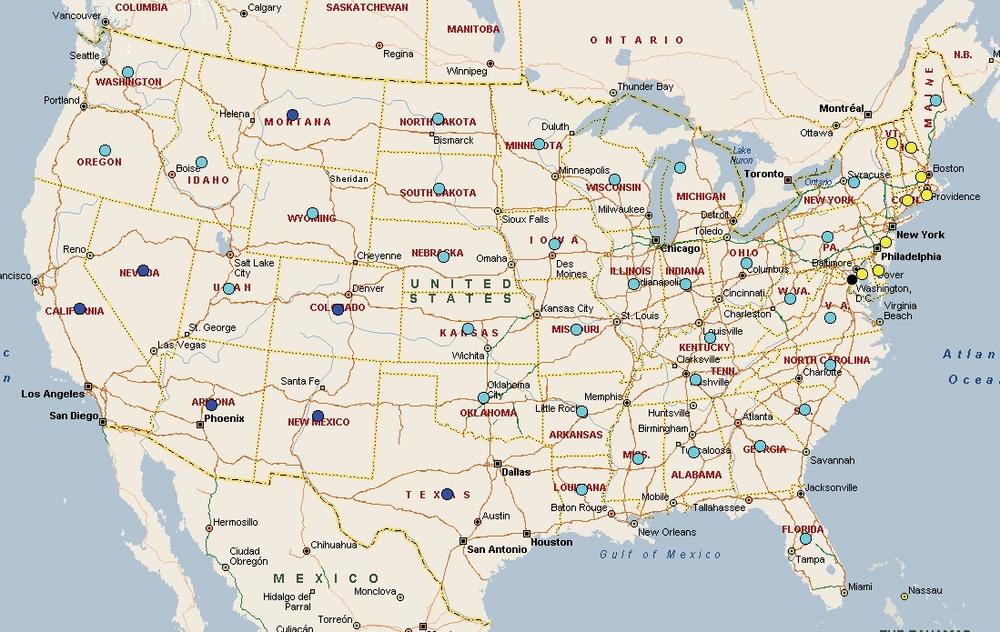
Figure Color Plate-2. (Figure 3-5).Multiple
symbol map
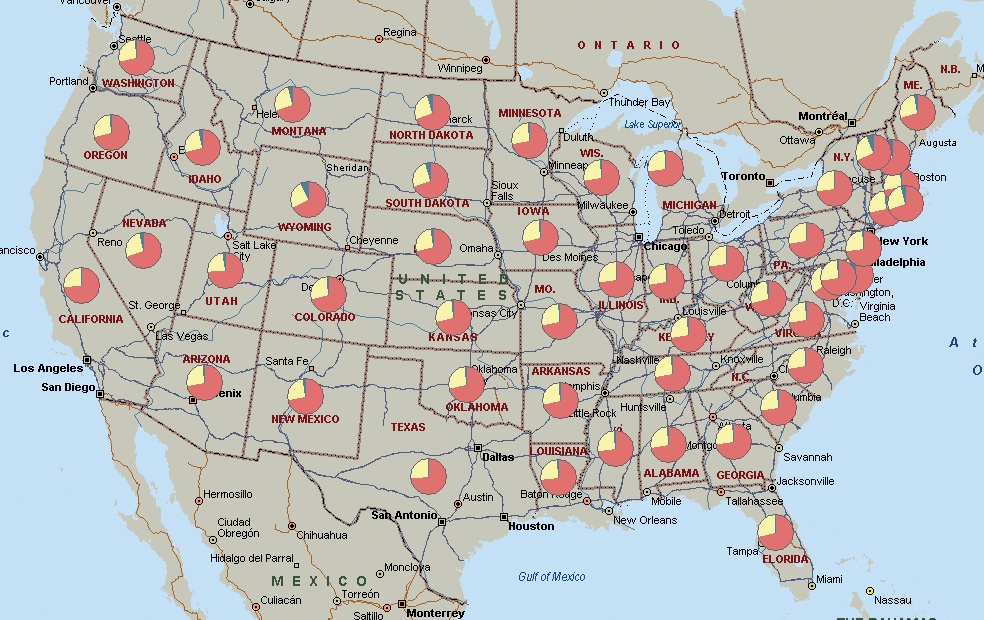
Figure Color Plate-3. (Figure 3-6).Pie
chart map
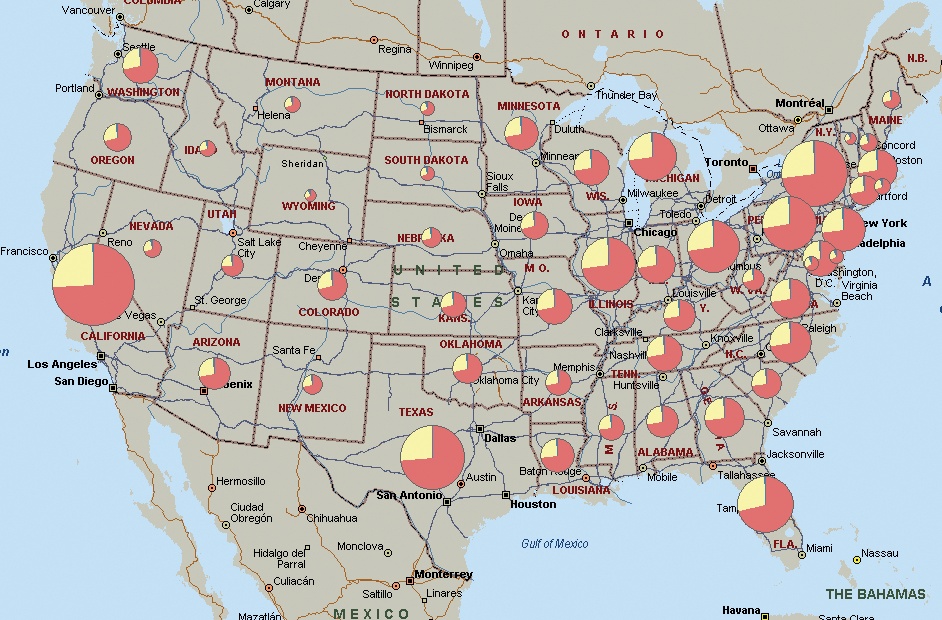
Figure Color Plate-4. (Figure 3-7).Sized
pie chart map
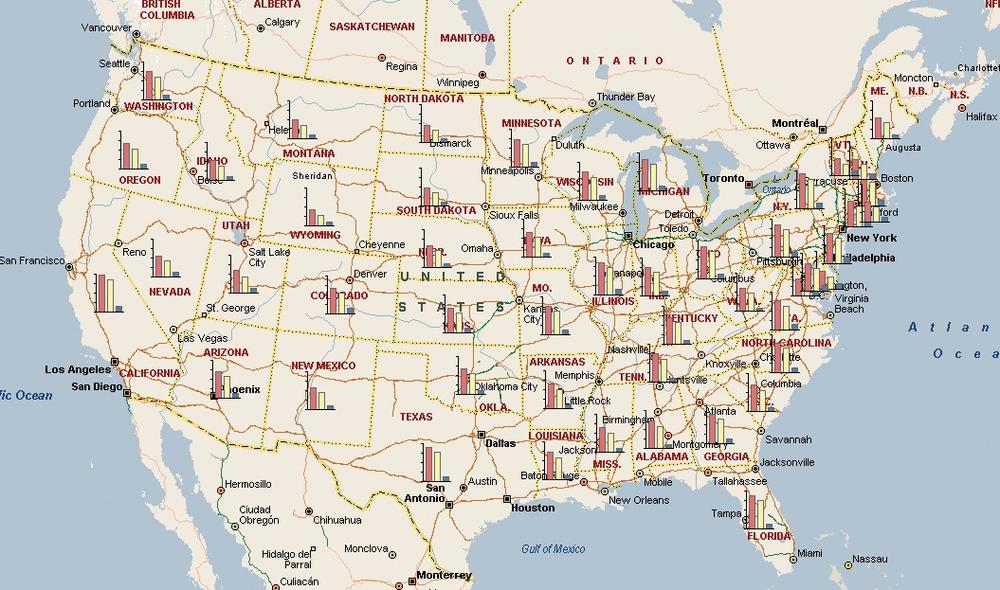
Figure Color Plate-5. (Figure 3-8).Column
chart map
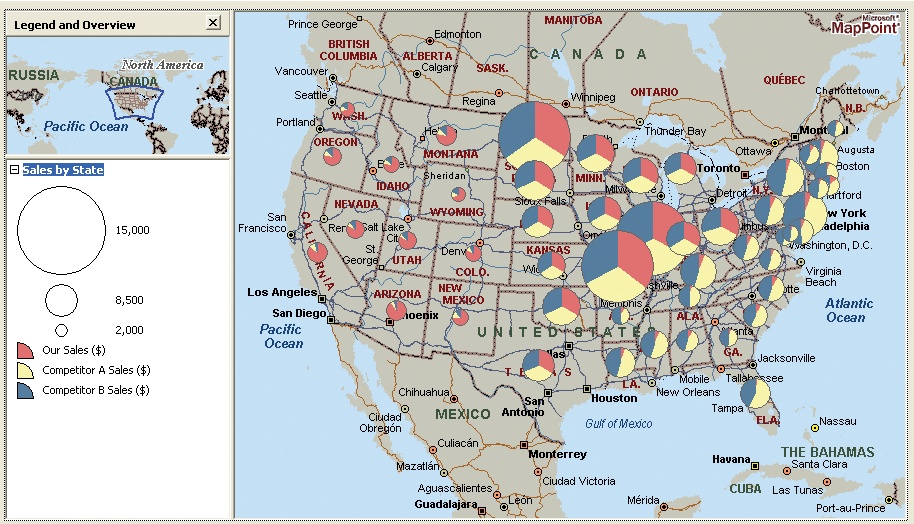
Figure Color Plate-6. (Figure 3-16).Sized
pie chart for sales comparison
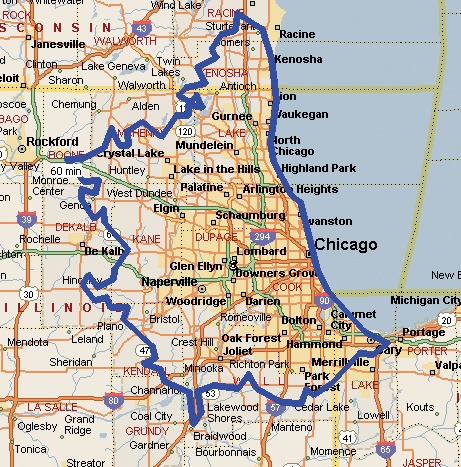
Figure Color Plate-7. (Figure 3-17).A
60-minute drivetime zone around O’Hare Airport
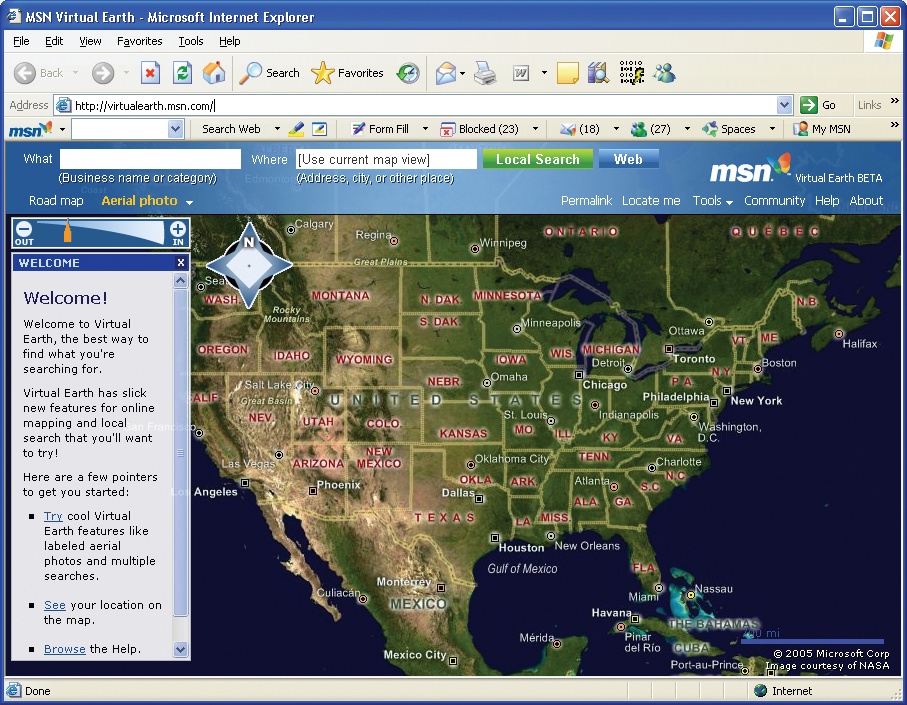
Figure Color Plate-8. (Figure
11-1).Virtual Earth map
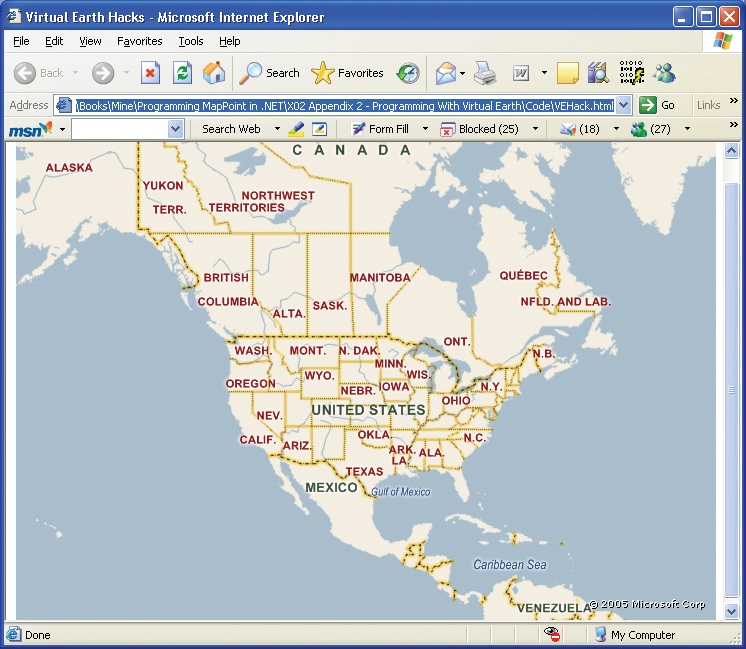
Figure Color Plate-9. (Figure 11-2).Map
Control: Absolute positioning in the body
Figure Color Plate-10. (Figure 11-3).Map ...
Get Programming MapPoint in .NET now with the O’Reilly learning platform.
O’Reilly members experience books, live events, courses curated by job role, and more from O’Reilly and nearly 200 top publishers.

