Add Series Lines and Bars
Series can have a variety of lines and bars attached to them. You can browse these lines and bars from the Format Data Series dialog box (Figures 17-3 and 17-4). To see this dialog, right-click a series and select Format Data Series.
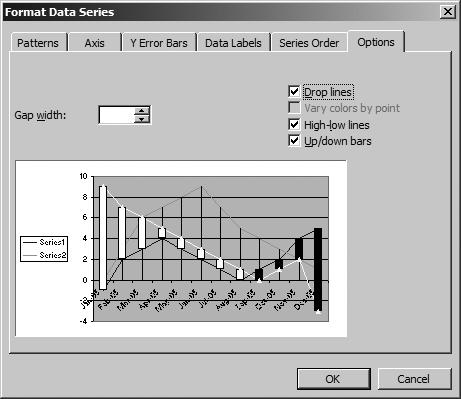
Figure 17-3. Drop lines, high-low lines, and up/down bars
You add drop lines, high-low lines, and up/down bars through the ChartGroup object. For example, the following code adds high-low lines to a line chart:
Sub AddHiLoLines( )
    Dim chrt As Chart, cg As ChartGroup
    ' Get the chart.
    Set chrt = ActiveChart
    ' Make it a line chart
    chrt.ChartType = xlLine
    ' Get the chart group
    Set cg = chrt.LineGroups(1)
    ' Add high-low lines
    cg.HasHiLoLines = True
End Sub
Tip
Only 2-D line chart types support high-low lines and up/down bars. Only 2-D line, bar, and column charts support error bars.
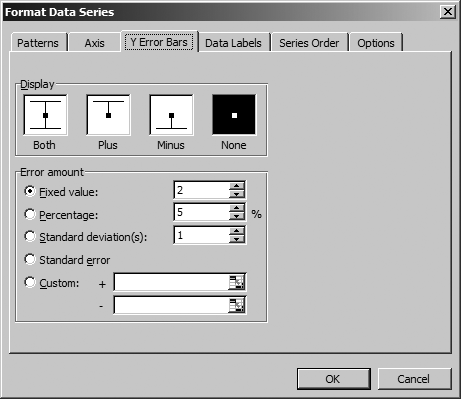
Figure 17-4. Error bars
You add error bars through the Series object. This code adds error bars to a line chart:
Sub AddErrorBars( )
    Dim chrt As Chart, sr As Series
    ' Get the chart.
    Set chrt = ActiveChart
    ' Make it a line chart
    chrt.ChartType = xlLineMarkers
    ' Get the chart group
    Set sr = chrt.SeriesCollection(1)
    ' Add error bars.
     sr.ErrorBar xlY, xlErrorBarIncludeBoth, xlErrorBarTypeStError
     ' Format the error bars.
    sr.ErrorBars.EndStyle = xlCap
End Sub
Get Programming Excel with VBA and .NET now with the O’Reilly learning platform.
O’Reilly members experience books, live events, courses curated by job role, and more from O’Reilly and nearly 200 top publishers.

