Create Combo Charts
Simple charts have one chart type: line, bar, column, or another chart type. Combo charts have two or more chart types combined for a single chart. Several of the custom chart types are combo charts, as shown in Figure 16-5.
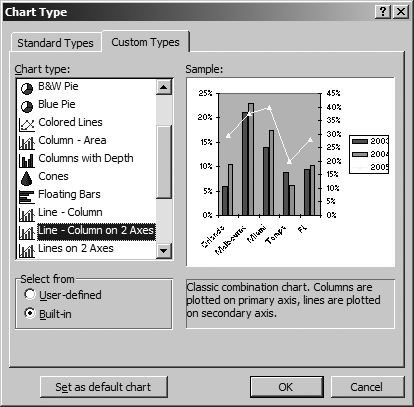
Figure 16-5. Some of the custom charts combine chart types
To create a combo chart in code, use the ApplyCustomType method as shown here:
Sub CreateComboChart1(  )
    Dim chrt As Chart
    ' Create a new chart sheet
    Set chrt = ThisWorkbook.Charts.Add
    ' Name the sheet.
    chrt.Name = "Combo Chart 1"
    ' Plot the data from a named range.
    chrt.SetSourceData [HomeSales], xlColumns
    ' Make the chart a combo chart
    chrt.ApplyCustomType xlBuiltIn, "Line - Column on 2 Axes"
End Sub
The custom chart types automatically choose which series to plot with which chart type. In the preceding code, the series is divided equally between column and line chart types. To control that a little more carefully, use the Series object’s ChartType property to create the combo chart instead:
Sub CreateComboChart2( ) Dim chrt As Chart, sc As SeriesCollection ' Create a new chart sheet Set chrt = ThisWorkbook.Charts.Add ' Name the sheet. chrt.Name = "Combo Chart 2" ' Plot the data from a named range. chrt.SetSourceData [HomeSales], xlColumns ' Set chart type chrt.ChartType = xlColumnClustered ' Get the series collection Set sc = chrt.SeriesCollection ' Change the type of the last series ...
Get Programming Excel with VBA and .NET now with the O’Reilly learning platform.
O’Reilly members experience books, live events, courses curated by job role, and more from O’Reilly and nearly 200 top publishers.

