Choose Chart Type
The ChartType property controls what type of chart to plot, but not all chart types are compatible with the data you may want to chart. For example, the xlStockOHLC chart plotted in the preceding section requires four series in a particular order: Open, High, Low, and Close prices. To try out different chart types:
Select the data to chart, then choose Insert → Chart to start the Chart Wizard.
Select a chart type and subtype then click the button below the subtype list to preview the result, as shown in Figure 16-4.
If the selected data doesn’t match what is required by the chart type, the preview displays a message explaining the problem.
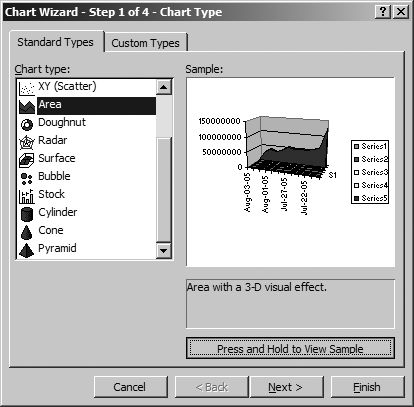
Figure 16-4. Trying out different chart types
Again, you can record your actions to find out the xlChartType constant for the chart type you want.
The DemoChartTypes procedure in the sample workbook cycles through all of the available ChartType settings, pausing after each. You can use that procedure to choose from the many chart types and find the corresponding xlChartType constant. That procedure is too long to reproduce in print, so here is an abridged version:
Sub DemoChartTypes( ) Dim chrt As Chart, secs As Double secs = 1 / 100000 Set chrt = Charts("Demo Chart Types") chrt.Activate chrt.ChartType = xl3DAreaStacked chrt.ChartTitle.Caption = "ChartType: xl3DAreaStacked" chrt.Refresh Application.Wait Now + secs ' Repeat for each ...Get Programming Excel with VBA and .NET now with the O’Reilly learning platform.
O’Reilly members experience books, live events, courses curated by job role, and more from O’Reilly and nearly 200 top publishers.

