Using the Visual Studio .NET Debugger
Arguably, the single most important tool in any development environment is the debugger. The Visual Studio debugger is very powerful, and it will be well worth whatever time you put into learning how to use it well. That said, the fundamentals of debugging are very simple. The three key skills are:
How to set a breakpoint and how to run to that breakpoint
How to step into and over method calls
How to examine and modify the value of variables, member data, and so forth
This chapter does not reiterate the entire debugger documentation, but these skills are so fundamental that it does provide a crash (pardon the expression) course.
The debugger can accomplish the same thing in many ways -- typically via menu choices, buttons, and so forth. The simplest way to set a breakpoint is to click in the lefthand margin. The IDE will mark your breakpoint with a red dot, as shown in Figure 2-5.
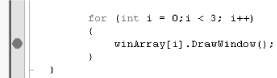
Figure 2-5. A breakpoint
Tip
Discussing the debugger requires code examples. The code shown here is from Chapter 5, and you are not expected to understand how it works yet (though if you program in C++ or Java, you’ll probably understand the gist of it).
To run the debugger you can choose Debug->Start
or just press F5. The program will compile and run to the
breakpoint, at which time it will stop and a yellow arrow will indicate the next statement for execution, as in ...
Get Programming C#, Second Edition now with the O’Reilly learning platform.
O’Reilly members experience books, live events, courses curated by job role, and more from O’Reilly and nearly 200 top publishers.

