30Using the Debugging Windows
THE CODE WINDOW
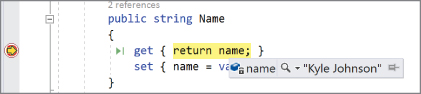
The most important window for debugging purposes is the code window. With the capability to set breakpoints and step through code, this window is the starting point for almost all debugging activities. Figure 30-1 shows a simple snippet of code with both a breakpoint (red dot) and the current execution point (yellow arrow) visible.
Breakpoints
The first stage in debugging an application is usually to identify the area causing the error by setting a breakpoint and gradually stepping through the code. Chapter 31, “Debugging ...
Get Professional Visual Studio 2017 now with the O’Reilly learning platform.
O’Reilly members experience books, live events, courses curated by job role, and more from O’Reilly and nearly 200 top publishers.

