Chapter 41Debugging with Breakpoints
Wrox.com Code Downloads for this Chapter
The wrox.com code downloads for this chapter are found at www.wrox.com/go/professionalvisualstudio2015 on the Download Code tab. The code and any related support files are located in their own folder for this chapter.
Long gone are the days when debugging an application involved adding superfluous output statements to track down where an application was failing. Visual Studio 2015 provides a rich, interactive debugging experience that includes breakpoints, tracepoints, and the Edit and Continue feature. This chapter covers how you can use these features to debug your application.
Breakpoints
A breakpoint is used to pause, or break, an application at a particular point of execution. An application that has been paused is in Break mode, causing a number of the Visual Studio 2015 windows to become active. For example, you can use the Watch window to view variable values. Figure 41.1 shows a breakpoint added to the constructor of the Customer class. The application breaks on this line if the Customer class constructor is called.
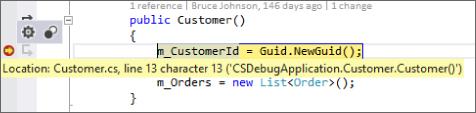
Setting ...
Get Professional Visual Studio 2015 now with the O’Reilly learning platform.
O’Reilly members experience books, live events, courses curated by job role, and more from O’Reilly and nearly 200 top publishers.

