41.10. Memory Windows
The next three windows are typically used for low-level debugging when all other alternatives have been exhausted. Stepping into memory locations, using a disassembler, or looking at registry values requires a lot of background knowledge and patience to analyze and make use of the information that is presented. There are only very rare cases while developing managed code when you would be required to perform debugging at such a low level.
41.10.1. Memory Windows 1–4
The four memory windows can be used to view the raw contents of memory at a particular address. Where the Watch, Autos, and Locals windows provide a way of looking at the content of variables, which are stored at specific locations in memory, the Memory window shows you the big picture of what is stored in memory.
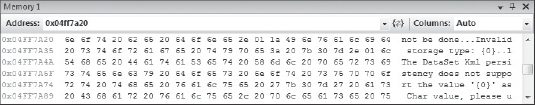
Each of the four Memory windows can examine different memory addresses to simplify debugging your application. Figure 41-12 shows an example of the information that can be seen using this window. The scrollbar on the right of the window can be used to navigate forward or backward through the memory addresses to view information contained in neighboring addresses.
Figure 41.12. Figure 41-12
41.10.2. Disassembly
Interesting debates arise periodically over the relative performance of two different code blocks. Occasionally this discussion devolves to talking about which MSIL instructions ...
Get Professional Visual Studio® 2008 now with the O’Reilly learning platform.
O’Reilly members experience books, live events, courses curated by job role, and more from O’Reilly and nearly 200 top publishers.

