45.2. Debugging with Code
Three classes ship with the .NET Framework under the System.Diagnostics namespace that can be used to build debugging support directly into your code — the Debug, Debugger, and Trace classes. When used properly, these classes provide a very powerful way for you to interact with the debugger.
The functionality provided by all three of these classes is exposed through static/shared methods and properties, which makes it easy to add them to your code.
45.2.1. The Debugger Class
The Debugger class provides programmatic access to certain debugger functions within Visual Studio. For example, the following code snippet will check whether the application is running under a debugger and, if not, launch one and attach to the process:
if (!Debugger.IsAttached)
{
    Debugger.Launch();
}
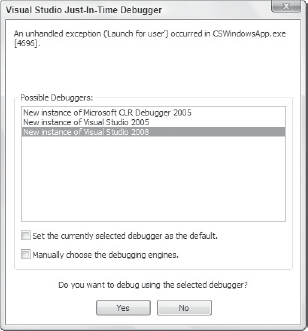
When this code is executed while the application is running normally outside Visual Studio, the program execution will pause, and you will be presented with a dialog box similar to the one shown in Figure 45-3. Selecting "New instance of Visual Studio 2008" will load the application in Visual Studio and continue executing the application in debug mode.
Figure 45.3. Figure 45-3
45.2.2. The Debug and Trace Classes
The Debug and Trace classes are used to output debugging information and trace the execution path of your application. Most of the properties and methods are common across ...
Get Professional Visual Studio® 2008 now with the O’Reilly learning platform.
O’Reilly members experience books, live events, courses curated by job role, and more from O’Reilly and nearly 200 top publishers.

