44.3. Debugging Silverlight
The Microsoft Silverlight Tools for Visual Studio 2008 install a native debugger into Visual Studio that makes it easy to debug Silverlight 2 applications. When you create a new Silverlight 2 application, Visual Studio will prompt you either to generate an HTML test page to host the Silverlight application, or to utilize an existing or new web project, as shown in Figure 44-9.
Figure 44.9. Figure 44-9
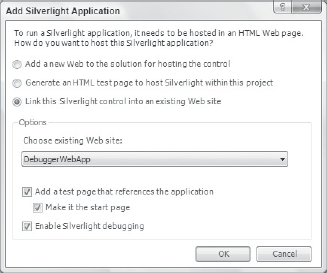
In Figure 44-9, we've chosen to create a test page that hosts the Silverlight application in the Web Application Project that is part of the existing solution, and to enable Silverlight debugging in this web application. If you select either of the other two options, you will not need to perform any additional steps to enable Silverlight debugging.
You can always enable or display support for Silverlight debugging in an existing Web Application Project under the Web option page of the project properties.
Once the Silverlight debugger is enabled, you will be able to set breakpoints in the code-behind class files of the XML pages. When the breakpoint is encountered during debug, the session will pause and display the current line of code, as shown in Figure 44-10. You will be able to step through the code, view the call stack, and interrogate the properties of objects, just as you would with any web or Windows Forms application.
The only major limitation ...
Get Professional Visual Studio® 2008 now with the O’Reilly learning platform.
O’Reilly members experience books, live events, courses curated by job role, and more from O’Reilly and nearly 200 top publishers.

