41.1. Code Window
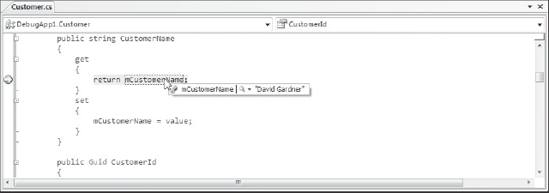
The most important window for debugging purposes is the code window. With the capability to set breakpoints and step through code, this window is the starting point for almost all debugging activities. Figure 41-1 shows a simple snippet of code with both a breakpoint and the current execution point visible.
Figure 41.1. Figure 41-1
41.1.1. Breakpoints
The first stage in debugging an application is usually to identify the area that is causing the error by setting a breakpoint and gradually stepping through the code. Setting breakpoints and working with the current execution point is covered in more detail in the next chapter. Although you can't see the color in Figure 41-1, breakpoints are marked in the code window with a red dot in the margin of the page and red highlighting of the code itself.
When a breakpoint is encountered, the current execution point is marked with a yellow arrow in the margin and the actual code is also highlighted in yellow. As discussed in the next chapter, this marker can be dragged forward and backward to control the order of execution. However, this should be done sparingly because it modifies the behavior of the application.
41.1.2. Datatips
After hitting a breakpoint, the application is paused, or is in Break mode. In this mode, you can retrieve information about current variables simply by hovering your mouse over the variable ...
Get Professional Visual Studio® 2008 now with the O’Reilly learning platform.
O’Reilly members experience books, live events, courses curated by job role, and more from O’Reilly and nearly 200 top publishers.

