55.7. Code Coverage
This is a very useful tool. It will instrument the code to help you see which lines of code are really being executed. First, you need to have a Test Project on your solution. As an example you will use "Your First Test Case" described in Chapter 20. Assuming you already created the SubscriptionTest class and CurrentStatusTest is passing, you will now activate Code Coverage.
To open the TestRun properties window, you can double-click the LocalTestRun.testrunconfig file in Solution Explorer or go to the menu Test ![]() Edit Test Run Configurations and select your active configuration. Figure 55-6 shows the Code Coverage options.
Edit Test Run Configurations and select your active configuration. Figure 55-6 shows the Code Coverage options.
Figure 55.6. Figure 55-6
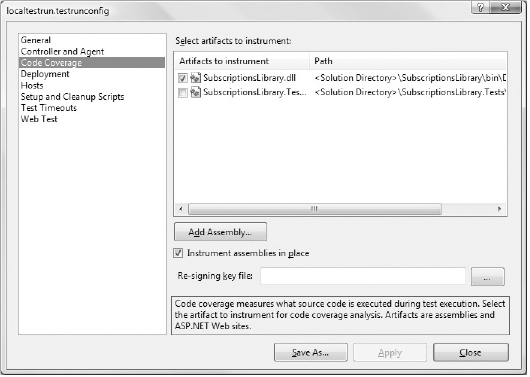
You need to select the assemblies to instrument. In case you are signing your assemblies, similar to the procedure when you are profiling using instrumentation, you need to resign them.
Now simply run your test and from the Test Results window right-click it and select Code Coverage. Figure 55-7 shows the Code Coverage window indicating the not-covered and covered blocks for each assembly, namespace, type, and member. Double-clicking a member will open the code file with the executed lines highlighted in blue (light shading in the figure) and untouched lines in red (darker shading in the figure) as shown in Figure ...
Get Professional Visual Studio® 2008 now with the O’Reilly learning platform.
O’Reilly members experience books, live events, courses curated by job role, and more from O’Reilly and nearly 200 top publishers.

