41.6. Call Stack
As applications grow in complexity, it is quite common for the execution path to become difficult to follow. The use of deep inheritance trees and interfaces can often obscure the execution path. This is where the call stack is useful. Each path of execution must have a finite number of entries on the stack (unless a cyclic pattern emerges, in which case a stack overflow is inevitable). The stack can be viewed using the Call Stack window, shown in Figure 41-8.
Figure 41.8. Figure 41-8
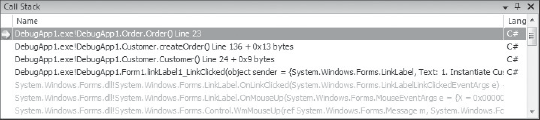
Using the Call Stack window, it is easy to navigate up the execution path to determine from where the current executing method is being called. This can be done by clicking any of the rows in the call stack, known as a stack frame. Other options available from the call stack, using the right-click context menu, enable viewing the disassembler for a particular stack frame, setting breakpoints, and varying what information is displayed.
Get Professional Visual Studio® 2008 now with the O’Reilly learning platform.
O’Reilly members experience books, live events, courses curated by job role, and more from O’Reilly and nearly 200 top publishers.

