15.4. Analyzing UDM Data using Microsoft Data Analyzer
Microsoft's Data Analyzer is a business intelligence client tool that allows you to analyze data graphically. With the help of charts, graphs, and easy navigation, Data Analyzer helps you to have a consolidated view on one screen so the user can better understand patterns of data and make business decisions. Data Analyzer provides the flexibility to configure various colors for showing data that help surface any anomalies in data quickly. The following steps show you how to analyze your UDM using Data Analyzer:
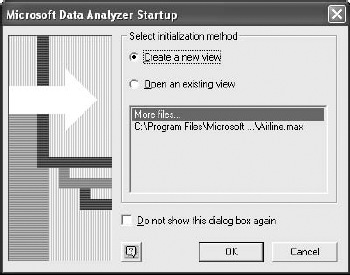
Launch Data Analyzer. You will see the Data Analyzer startup page, which allows you to create a new view or open an existing view as shown in Figure 15-49. Select the option to create a new view and click the OK button, and then click the Next button on the welcome page.
Figure 15.49. Figure 15-49
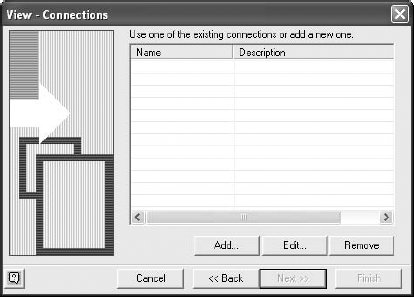
If you had already established connections you will see the connections in the view connections page. The view connections page (Figure 15-50) shows a clean slate to start with. Click the Add button to create a new connection to Analysis Services 2005.
Figure 15.50. Figure 15-50
Data Analyzer allows you to connect to Analysis Services directly via TCP or over HTTP; it also allows you to analyze data from a local cube file. In ...
Get Professional SQL Server™ Analysis Services 2005 with MDX now with the O’Reilly learning platform.
O’Reilly members experience books, live events, courses curated by job role, and more from O’Reilly and nearly 200 top publishers.

