6.1. Creating a Linked Report
One of the really powerful features in Reporting Services is the ability to create two reports and, essentially, hyperlink them together. To understand what this means, take a look at Figure 6-1.
Figure 6-1. Figure 6-1
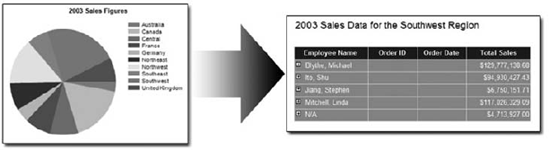
This provides a good example of how a linked report might flow and be used in your own environment. In this example, the first report is a pie chart that shows summary sales data information for the year 2003, while the matrix of data is a more detailed listing of sales data for a particular region. The "link" for these reports, then, is the pie segment associated with a particular region (for instance, the Southwest region). For these reports, a user would simply click the pie segment for the Southwest region and be automatically and seamlessly taken to the detail report for the Southwest region. This is a linked report.
In this section, you will see how to create both reports and how to link them together. Linked reports can be a really big piece of any kind of dashboard reports or other aggregate data reports you may need to generate for your own projects. Once you understand how reports are linked, it isn't terribly hard to make linking work.
6.1.1. STEP 1: The Data Backend
As discussed in Chapter 5, it is a good idea to keep all of your data objects in your data layer and merely call them from your reporting layer, much like ...
Get Professional Microsoft® SharePoint® Server 2007 Reporting with SQL Server 2008 Reporting Services now with the O’Reilly learning platform.
O’Reilly members experience books, live events, courses curated by job role, and more from O’Reilly and nearly 200 top publishers.

