ASP.NET Tracing
ASP.NET Tracing is a powerful tool to gain valuable information when troubleshooting dynamic code. Although there isn't anything new to IIS 8.0 in this tracing section, it is a key tool to understand.
ASP.NET Tracing provides detailed information about each page that is run. Unlike Failed Request Tracing, which records the information to an XML format saved to disk, page-level tracing can be displayed within the page itself, by using the ASP.NET Trace Viewer, or through code. This enables the developer or system administrator to easily view detailed information about the entire page request, including the precise timestamps of all of the page events, cookie and session state information, request and response and header information, and plenty of other information.
Figure 23.19 shows a small portion of a page-level trace. This trace is added to the bottom of the existing page, below your normal content. This is ideal during development but is obviously not meant for production because of the detailed information that is embedded into the page for everyone to see. Notice the custom trace information and the timestamps, which are approximately 1,000 milliseconds apart from each other.
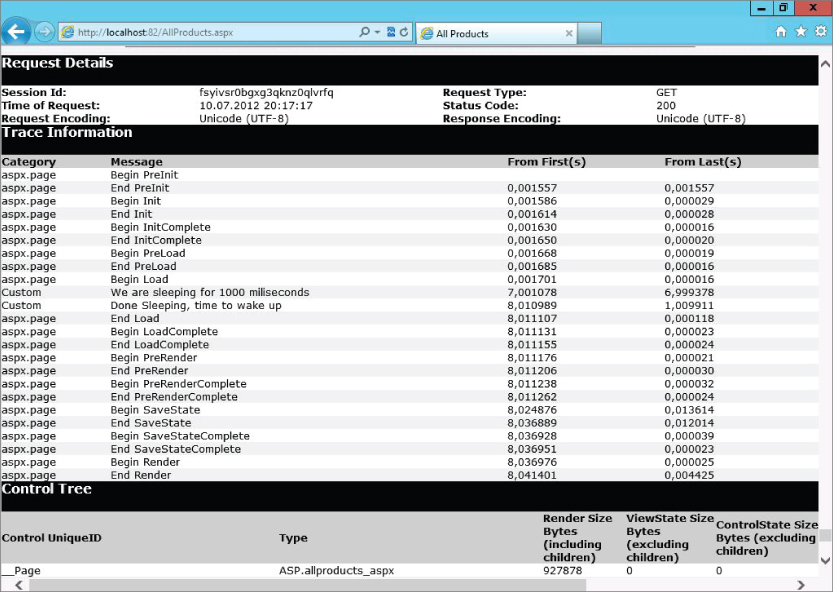
The following code was added to the page in Figure 23.19:
using System.Diagnostics; public partial class _Default : System.Web.UI.Page { Protected void Page_Load(object ...Get Professional Microsoft IIS 8 now with the O’Reilly learning platform.
O’Reilly members experience books, live events, courses curated by job role, and more from O’Reilly and nearly 200 top publishers.

