Student Exercises
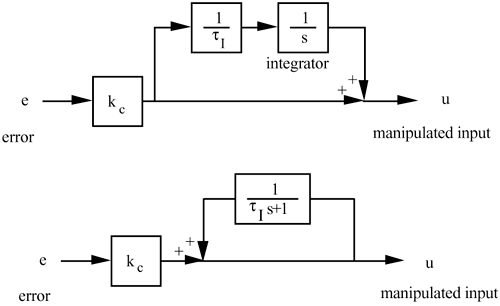
| 1: | Verify that the two block diagrams below result in the same PI control algorithm transfer function.
|
| 2: | Use the SIMULINK diagram presented in Figure 11-16 to verify the results presented in Example 11.1. Show that, as the setpoint change approaches 0.5 the integral windup effect becomes worse. |
| 3: | Verify the results of Example 11.2 using a SIMULINK simulation. Also, discuss the effect of the resetting time, τr, on the ARW results. |
| 4: | Consider the process furnace temperature cascade control system shown in Figure 10-2, where the output of the temperature control loop is a setpoint for the fuel gas flow controller. Draw a signal, similar ... |
Get Process Control: Modeling, Design, and Simulation now with the O’Reilly learning platform.
O’Reilly members experience books, live events, courses curated by job role, and more from O’Reilly and nearly 200 top publishers.


