Additional Exercises
| 1: | Plot the following three curves on a single plot and a multiple plots (using the subplot command): 2 cos(t), sin(t), and cos(t)+sin(t). Use a time period such that two or three peaks occur for each curve. Use solid, dashed, and + symbols for the different curves. Use roughly 25–50 points for each curve. |
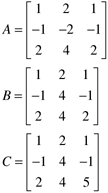
| 2: | a. Calculate the rank, determinant, and matrix inverse of the following matrices (use help rank, help det, and help inv):
|
| 3: | Find C·C–1 where
|
| 4: | Calculate xTx, and calculate xxT where |
| 5: | Find the eigenvalues of the matrix |
| 6: |
Get Process Control: Modeling, Design, and Simulation now with the O’Reilly learning platform.
O’Reilly members experience books, live events, courses curated by job role, and more from O’Reilly and nearly 200 top publishers.


