The Sketch
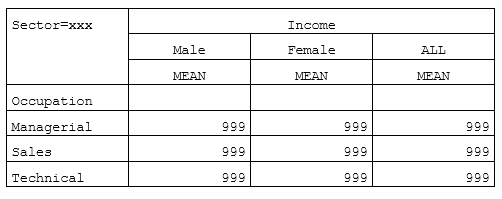
Once again, we are looking
at mean income. In this case, we want to see how it varies by gender,
occupation, and employment sector. It would be easy to put any two
of these three classifications in a table. But to put all three on
one page would be difficult both to fit and to interpret. This is
where the page dimension comes in handy. We are going to build a table
of income by gender and occupation and then repeat the table across
multiple pages, one for each employment sector.
Figure 6.1 Quick Sketch of Your Table Plan
Get PROC TABULATE by Example, Second Edition now with the O’Reilly learning platform.
O’Reilly members experience books, live events, courses curated by job role, and more from O’Reilly and nearly 200 top publishers.

