Creating a pie chart
The pieChart component visualizes category data as a pie chart.
How to do it...
A simple definition for a pie chart with categories of data for displaying hours spent per day is shown as follows:
<p:pieChart value="#{pieChartController.model}" style="height:250px" title="Hours per Day" />The chart will be rendered as follows:
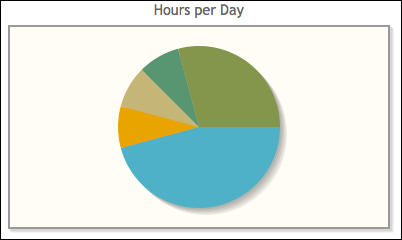
The model that binds to the component should be an instance of org.primefaces.model.chart.PieChartModel. The definition of the model along with the categories is given in the following code snippet:
PieChartModel model = new PieChartModel(); model.set("Work", 11); model.set("Eat", 2); model.set("Commute", ...Get PrimeFaces Cookbook now with the O’Reilly learning platform.
O’Reilly members experience books, live events, courses curated by job role, and more from O’Reilly and nearly 200 top publishers.

