Creating a bar chart
The barChart component visualizes the series of point data as bars in a graph.
How to do it...
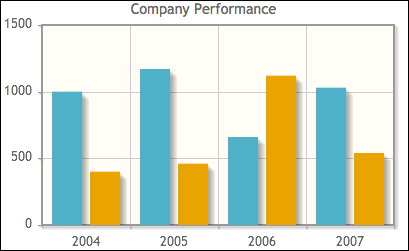
A simple definition for a bar chart to display two series of data is shown in the following code snippet:
<p:barChart value="#{barChartController.model}" style="height:250px" title="Company Performance" />The chart will be rendered as shown in the following screenshot:
The model that binds to the component should be an instance of the org.primefaces.model.chart.CartesianChartModel class. The definition of data with two sample series is shown in the following code snippet:
CartesianChartModel model = new CartesianChartModel(); ChartSeries ...
Get PrimeFaces Cookbook now with the O’Reilly learning platform.
O’Reilly members experience books, live events, courses curated by job role, and more from O’Reilly and nearly 200 top publishers.

