Creating a line chart
The lineChart component visualizes series of point data as lines in a graph.
How to do it...
A simple definition for a line chart with two series of data to display is as follows:
<p:lineChart value="#{chartController.model}" style="height:250px" />The chart will be rendered as follows:
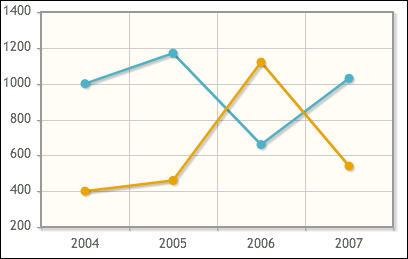
The model that binds to the component should be an instance of org.primefaces.model.chart.CartesianChartModel. The definition of data with two sample series is shown next:
CartesianChartModel model = new CartesianChartModel(); ChartSeries sales = new ChartSeries(); sales.setLabel("Sales"); sales.set("2004", 1000); sales.set("2005", 1170); sales.set("2006", ...Get PrimeFaces Cookbook now with the O’Reilly learning platform.
O’Reilly members experience books, live events, courses curated by job role, and more from O’Reilly and nearly 200 top publishers.

