
167
13
Frequency Modelling: Adjusting
for Claim Count IBNR
We now get into the heart of the frequency/severity model. We rst turn our attention to
frequency modelling. Because producing a frequency model means calculating the char-
acteristics of the frequency distribution such as its mean and its variance, we need to know
the ultimate claim count for each year. However, the only information we have is the num-
ber of claims reported in any particular year. To go from the reported claim count to the
ultimate claim count, we need to estimate the number of incurred but not (yet) reported
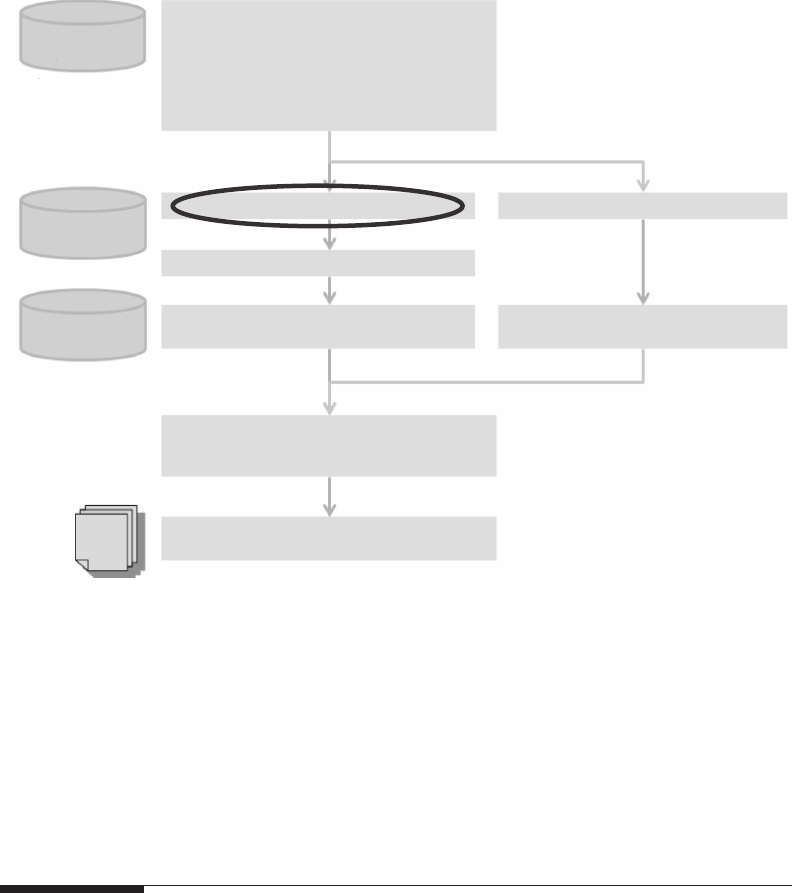
(IBNR) claims. The objective of this section is to illustrate how this can be done. Figure 13.1
shows how IBNR adjustment ts in the risk costing process – this will help us not to lose
track of the overall scheme of things.
13.1 Input to IBNR Adjustment
The data required for the IBNR adjustment are roughly the same as those described for the
pricing exercise as a whole, and are spelled out in Chapter 8, except for the information on
the exact claim amounts. To recap, we need individual claims information, and for each
claim, we need at least:
• The loss occurrence date.
• The reporting date.
• The quantication date (the date at which a non-zero incurred amount was rst
attached to a claim).
• The date at which the claim was set back to zero (if applicable) because at that point the
loss will disappear from the count of non-zero losses. This replaces the require-
ment of the individual transition dates for every claim transition, that is, all times
at which the outstanding loss amount was revised.
In practice, we may not always be able to have all the information above. Frequently, if
we have individual-claim information, we may only have a snapshot of the claims infor-
mation at a point in time, and only the most basic dates (loss date and reporting date) may
be available, as in Figure 13.2: in this case, we may need to make some assumptions on the
quantication date and on the issue of claims going back to zero.
Alternatively, we may be given claim count triangulations such as that in Figure 13.3, in
which the number of non-zero claims at different points in time is predigested for us. This
is summarised information and therefore not as complete as individual-claim informa-
tion, but at least it takes into account the issue of non-zero claims automatically.
168 Pricing in General Insurance
It sometimes happens that we simply do not have enough information to make a judg-
ment on the delays; for example, because we are missing the loss date or the reporting date.
In these cases, we will need to use external information to assess IBNR levels.
In the rest of this chapter, we will make use of the case study introduced in Chapter 11,
and for which the data set is also available on the book’s website.
13.2 Triangle Development Methods for IBNR Estimation
The most common method for the estimation of the number of IBNR claims is based on
the development of claims count triangles, using the chain ladder or other similar triangle
development techniques for projecting the claim count to ultimate.
The main assumptions in doing this projection are that
a. All years develop in roughly the same way (so that we can apply past development
factors to the years currently not complete).
b. There is no further development for the earliest year (so that we do not have to
worry about developments after a certain number of years).
Individual
loss data
Assumptions on
– Loss inflation
–
Currency conversion
– …
Exposure
data
Portfolio/market
information
Data preparation
– Data checking
– Data cleansing
– Data transformation
– Claims revaluation and currency conversion
– Data summarisation
– Calculation of simple statistics
Inputs to frequency/severity analysis
Adjust historical claim counts for IBNR
Adjust for exposure/profile changes
Select severity distribution and
calibrate parameters
Select frequency distribution and
calibrate parameters
Adjust loss amounts for IBNER
Severity mode
l
Frequency model
Estimate gross aggregate distribution
e.g. Monte Carlo simulation, Fast Fourier
transform, Panjer recursion…
Gross aggregate loss model
Ceded/retained aggregate loss model
Allocate losses between (re)insurer and
(re)insured
Cover
data
FIGURE 13.1
This is how adjusting for the number of IBNR claims ts in the overall risk costing process. Specically, it is part
of frequency analysis, which eventually leads to a frequency model.
Get Pricing in General Insurance now with the O’Reilly learning platform.
O’Reilly members experience books, live events, courses curated by job role, and more from O’Reilly and nearly 200 top publishers.

