
123
10
Data Preparation
Modelling is rarely an automated process by which one transforms a raw set of data into a
set of results. Before any modelling can be attempted, a signicant amount of exploratory
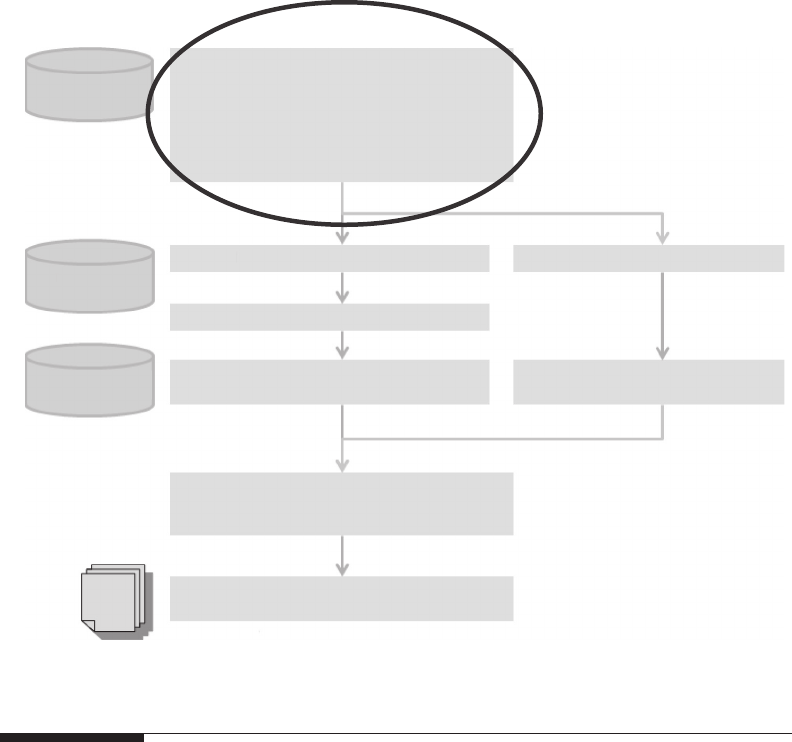
work often needs to be carried out on the raw data. For lack of a standard term, we call this
exploratory work ‘data preparation’ (Figure 10.1). This is often an open-ended exercise but
will normally involve the following activities:
• Checking data to determine whether there are errors or anomalies
• Summarising data to provide a bird’s-eye view of the risk and understand obvious
trends/anomalies
• Preparing a standardised input for the rest of the risk costing process, in particu-
lar for the frequency and the severity analysis
To keep things as concrete as possible, let us illustrate data preparation using a real-
world data set, in which amounts and names have been disguised beyond recognition for
data privacy purposes. The policyholder (or prospective policyholder) discussed here is in
facilities management, and the policy is public liability.
An excerpt from the data can be seen in Figure 10.2. The complete version of the data
set (with more columns and many more rows) contains 1718 claims, some of which are
claims with zero amounts. In the following, we will keep this example in mind to illustrate
the various steps of data preparation. We assume that we need to price an annual public
liability policy that incepts on 1 April 2015. We assume claims ination to be 5% (a com-
mon assumption for liability business). The claims data are given in pounds, but the policy
needs to be priced in euros. The exchange rate used here was 1£ = 1.2€.
A typical process will look something like a three-step approach involving data
cleansing (Section 10.1), data transformation (Section 10.2) and data summarisation
(Section 10.3).
10.1 Data Cleansing
Claims data are ‘cleansed’ and obvious mistakes are corrected. In a large company, this
may be done by teams that specialise in data cleansing and have systematic ways for
checking for anomalies such as data in the wrong format, gures that do not add up (e.g.
paid + outstanding not being equal to incurred) and so on. Anything dubious will be
referred back to the analyst. If some elds are missing, suitable assumptions must be made
about them.
124 Pricing in General Insurance
10.2 Data Transformation
Claims data are transformed so that they are ready to use in the rest of the risk costing
process. Some examples of data transformations, which should not be seen as exhaustive
in all cases, are illustrated in the following sections.
10.2.1 Claims Revaluation
The full incurred amount of all claims is revalued to bring them to the average point of
occurrence t* of the renewal policy by using the appropriate ination index I(t) as dis-
cussed in Chapter 9. More specically, this can be done by
a. Calculating the average point of occurrence t* of the renewal policy. This is nor-
mally the midpoint of the policy: e.g. for an annual policy incepting on 1 April 2015,
the midpoint will be 1 October 2015. However, if the claims exhibit seasonality (e.g.
if there are more claims during winter), then t* might be different from the mid-
point. In general, for a policy incepting at t = 0 and expiring at t = T,
tttdt
T
* =
∫
ν()
0
,
Individual
loss data
Assumptions on
– Loss inflation
–
Currency conversion
– …
Exposure
data
Portfolio/market
information
Adjust historical claim counts for IBNR
Adjust for exposure/profile changes
Select severity distribution and
calibrate parameters
Select frequency distribution and
calibrate parameters
Adjust loss amounts for IBNER
Severity mode
l
Frequency model
Estimate gross aggregate distribution
e.g. Monte Carlo simulation, Fast Fourier
transform, Panjer recursion…
Gross aggregate loss model
Ceded/retained aggregate loss model
Allocate losses between (re)insure and
(re)insured
Cover
data
Data preparation
– Data checking
– Data cleansing
– Data transformation
– Claims revaluation and currency conversion
– Data summarisation
– Calculation of simple statistics
Inputs to frequency/severity analysis
FIGURE 10.1
This is how exploratory analysis ts in the risk costing process.
Get Pricing in General Insurance now with the O’Reilly learning platform.
O’Reilly members experience books, live events, courses curated by job role, and more from O’Reilly and nearly 200 top publishers.

