4.8 Implementation of the Predictive Control Strategy
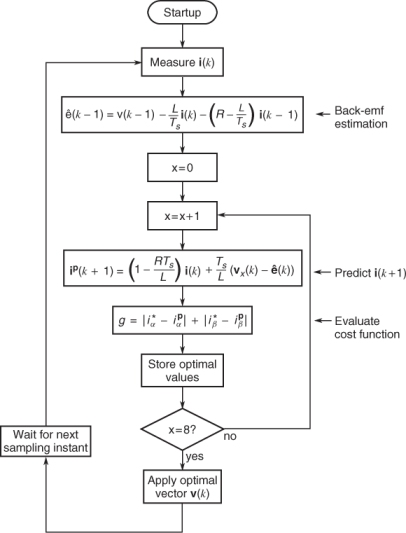
A flow diagram of the different tasks performed by the predictive controller is shown in Figure 4.8. Here, the outer loop is executed every sampling time, and the inner loop is executed for each possible state, obtaining the optimal switching state to be applied during the next sampling period.
Figure 4.7 Working principle: values of the cost function for each voltage vector
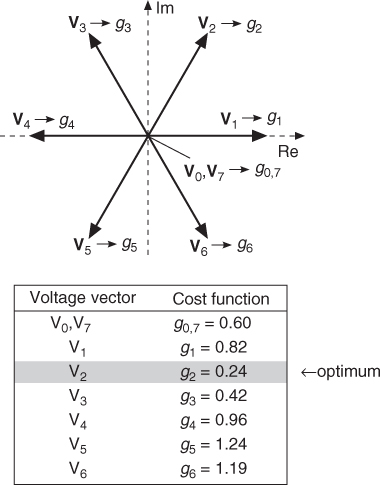
The timing of the different tasks is shown in Figure 4.9, and, as illustrated here, the most time-consuming task is the prediction and selection of the optimal switching state. This is due to the calculation of the load model and cost function, which is executed seven times, once for each different voltage vector.
Figure 4.8 Flow diagram of the predictive current control (Rodriguez et al., 2007 © IEEE)
The predictive current control strategy is implemented for simulation in MATLAB as a S-Function, containing the following code:
    ek = v(xop_1) - L/Ts*ik - (R-L/Ts)*ik_1;
    g_opt = inf;
    for i=1:7
        ik1 = (1-R*Ts/L)*ik + Ts/L*(v(i)-ek);
        g = abs(real(ik_ref-ik1)) + abs(imag(ik_ref-ik1));
        if (g<g_opt)
            g_opt = g;
            x_opt = i;
        end
    end
    xop_1=xop;
    xop=x_opt;
where ik = i(k), ik1 = i(k + 1), ik_1 = i(k − 1), and ek = e(k). The optimal voltage vector that minimize the ...
Get Predictive Control of Power Converters and Electrical Drives now with the O’Reilly learning platform.
O’Reilly members experience books, live events, courses curated by job role, and more from O’Reilly and nearly 200 top publishers.

