Analyzing your data
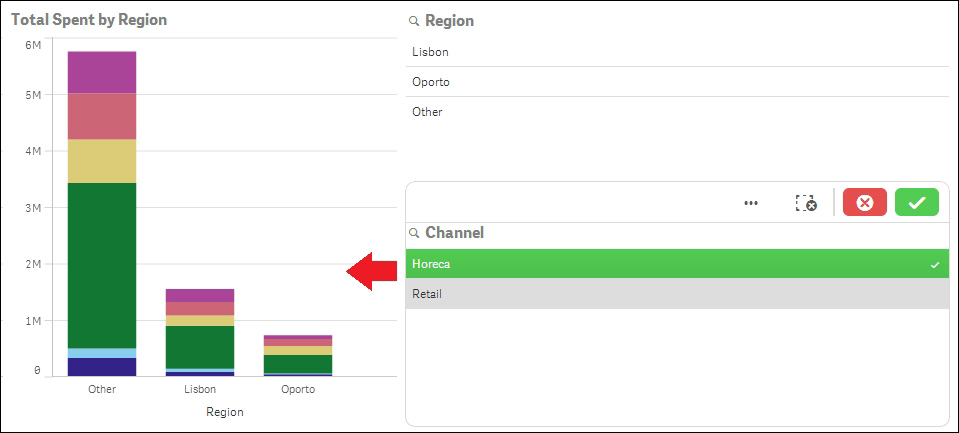
Our new application has two filters we can use to get a response to our questions. Select Horeca in the Channel filters. The application responds by actualizing the data. Now everything you see is related to the Horeca customers. Use the green or red buttons to confirm or cancel your selection. This is depicted in the following screenshot:
In the following screenshot, I've selected Horeca and Porto, and in the Top Customers table, I can see the top 10 Horeca customers in Porto. Now you can use the filters and the visualizations we've created to answer your own questions:
Tip
You can filter the data using the filters we've put in ...
Get Predictive Analytics Using Rattle and Qlik Sense now with the O’Reilly learning platform.
O’Reilly members experience books, live events, courses curated by job role, and more from O’Reilly and nearly 200 top publishers.

