Figure 2.40 Limit as x → c
Limits by Graphing or by Table
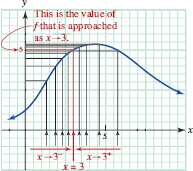
Figure 2.40 shows the graph of a function f and the number c = 3.
The arrowheads are used to illustrate possible sequences of numbers along the x-axis, approaching from both the left and the right. As x approaches c = 3, f(x) gets closer and closer to 5. We write this as
![]()
As x approaches 3 from the left, we write x → 3-, and as x approaches 3 from the right, we write x → 3+. We say that the limit at x = 3 exists only if the value approached from the left is the same as the value approached ...
Get Precalculus: A Functional Approach to Graphing and Problem Solving, 6th Edition now with the O’Reilly learning platform.
O’Reilly members experience books, live events, courses curated by job role, and more from O’Reilly and nearly 200 top publishers.

