For a known periodicity of seasonal variations, seasonal sub series redraws the original series over batches of successive time periods. For example, the periodicity in the CO2 concentrations is 12 months and based on this a seasonal sub series plots on mean and standard deviation of the residuals are shown in the following figure. To visualize seasonality in the residuals, we create quarterly mean and standard deviations.
A seasonal sub series reveals two properties:
- Variations within seasons as within a batch of successive months
- Variations between seasons as between batches of successive months
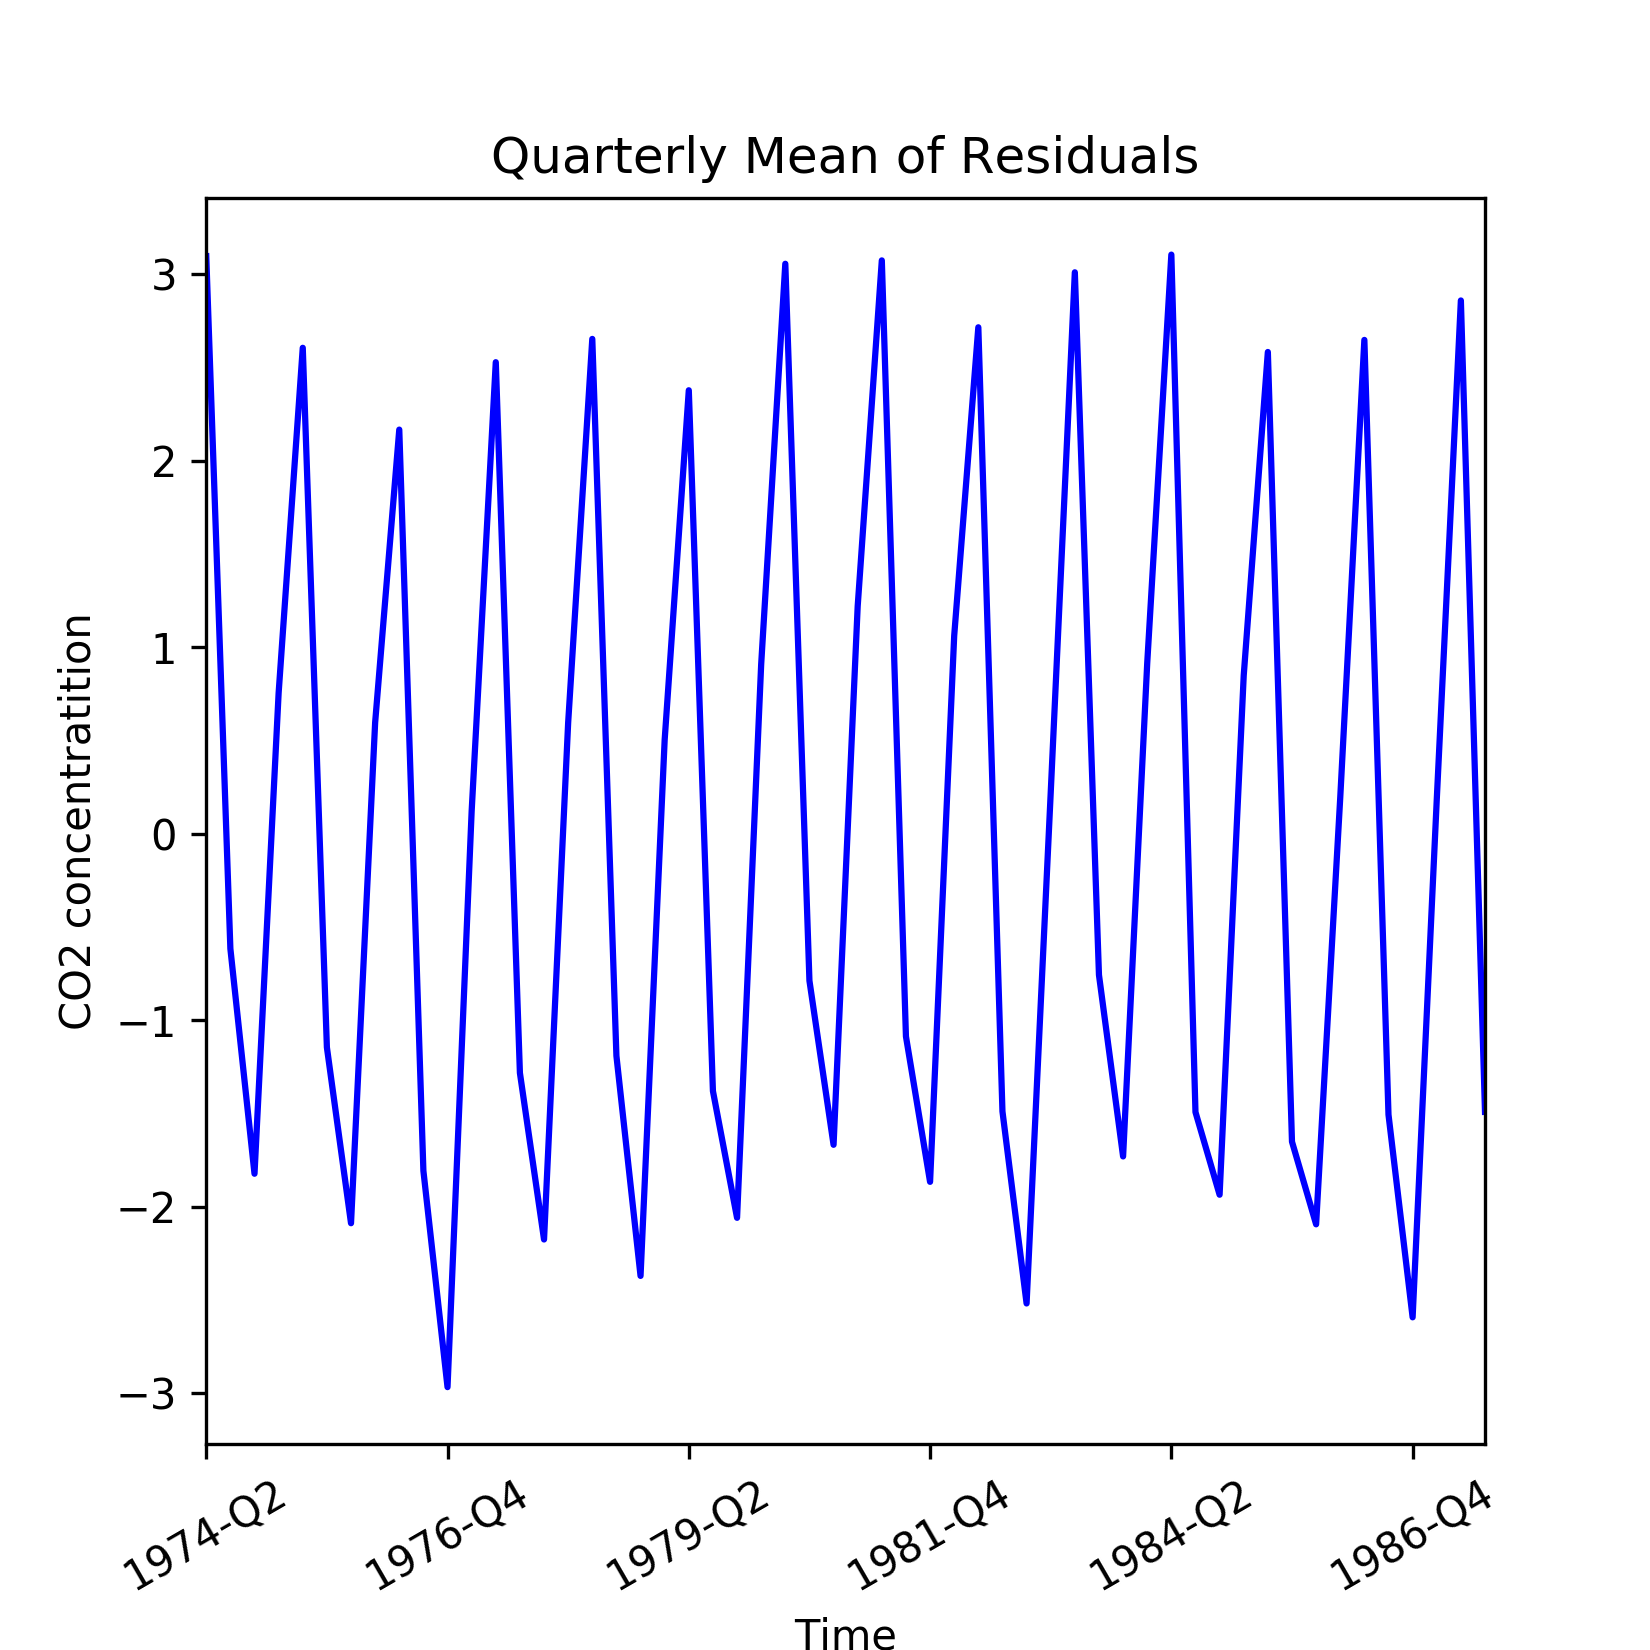
Figure 1.8: Quarterly ...

