The seasonal sub series plot can be more informative when redrawn with seasonal box plots as shown in the following figure. A box plot displays both central tendency and dispersion within the seasonal data over a batch of time units. Besides, separation between two adjacent box plots reveal the within season variations:
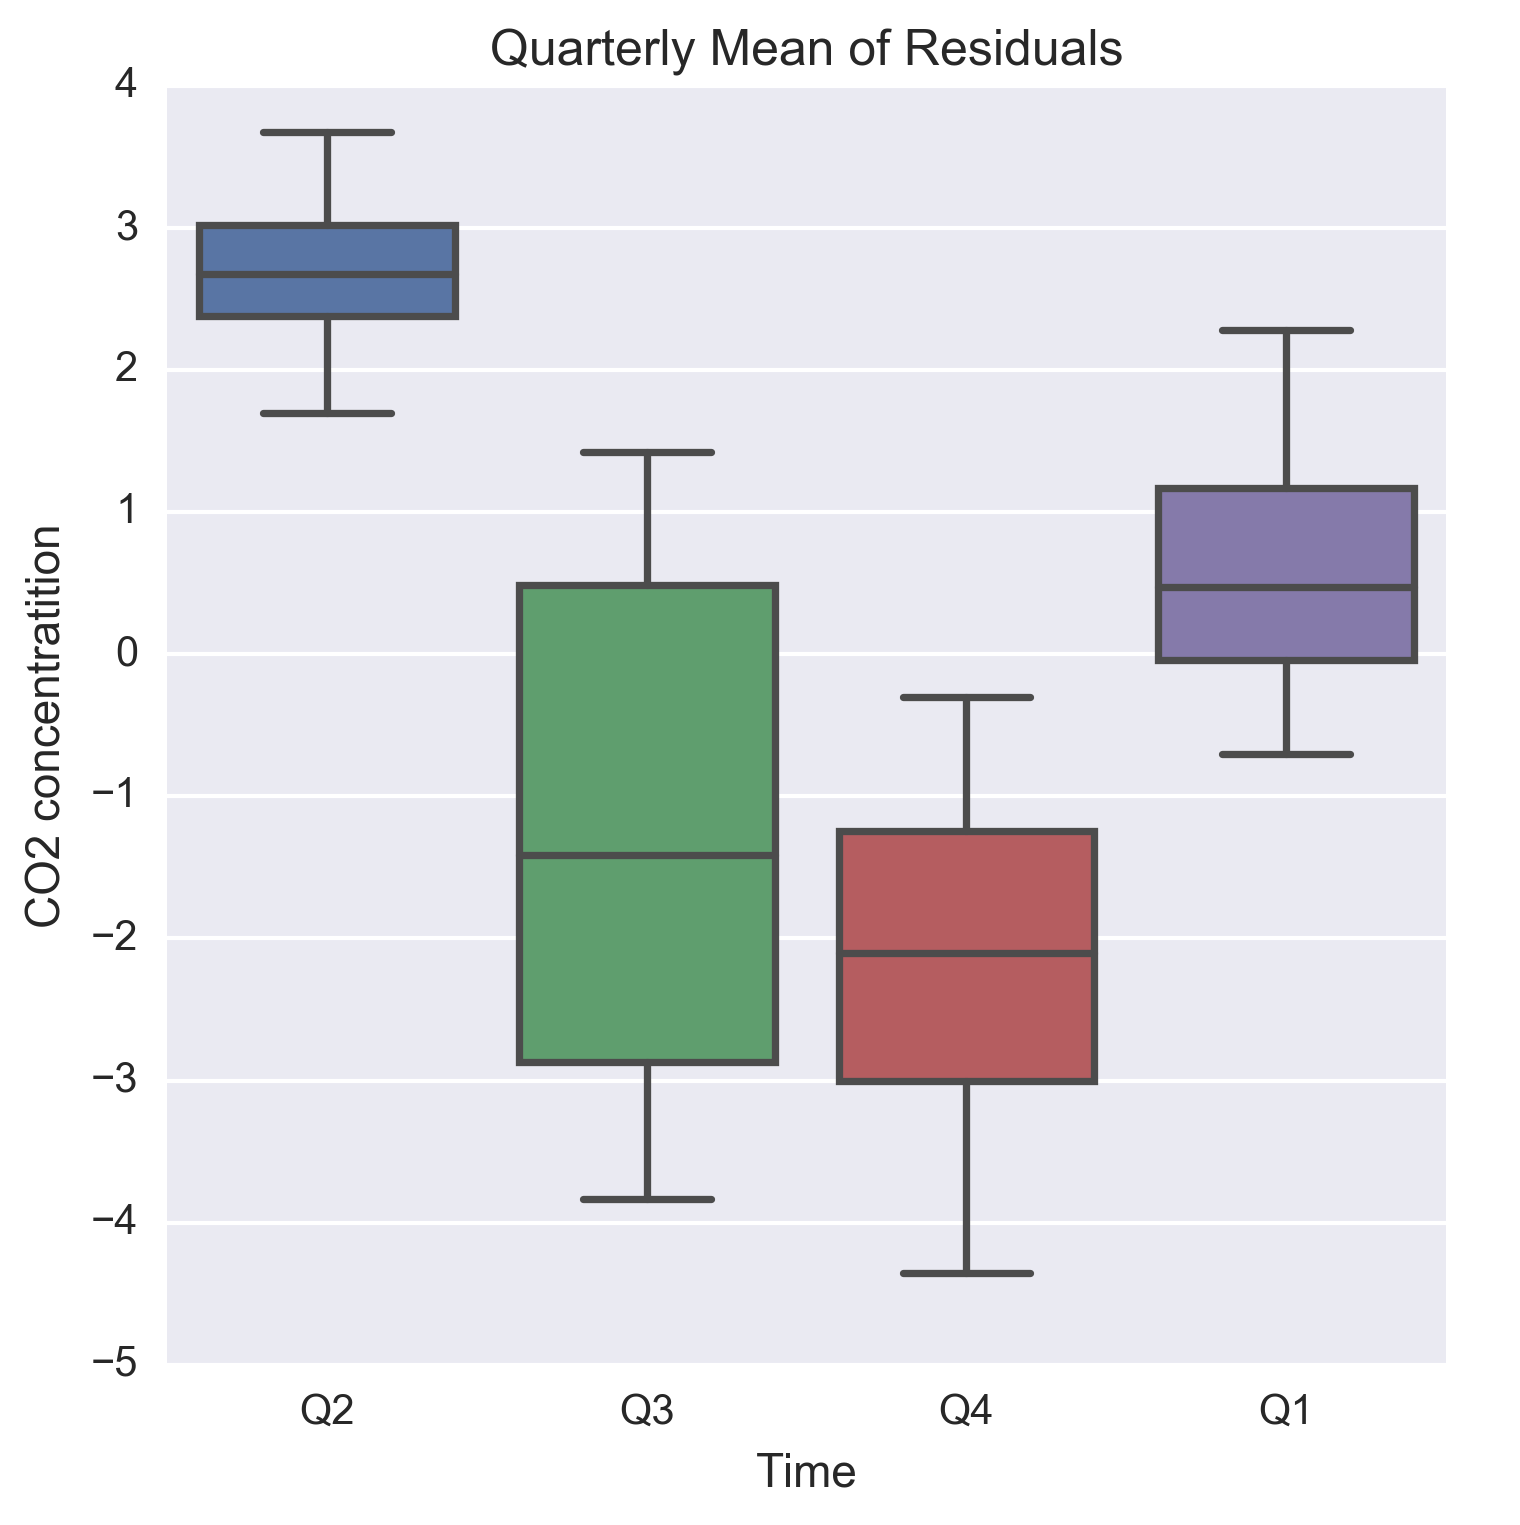
Figure 1.10: Quarterly boxplots of the residuals from a linear model of the general trend in CO2 readings
The code for generating the box plots is as follows:
plt.figure(figsize=(5.5, 5.5)) g = sns.boxplot(data=data, y='Residuals', x='Quarter') g.set_title('Quarterly Mean of Residuals') g.set_xlabel('Time') ...
